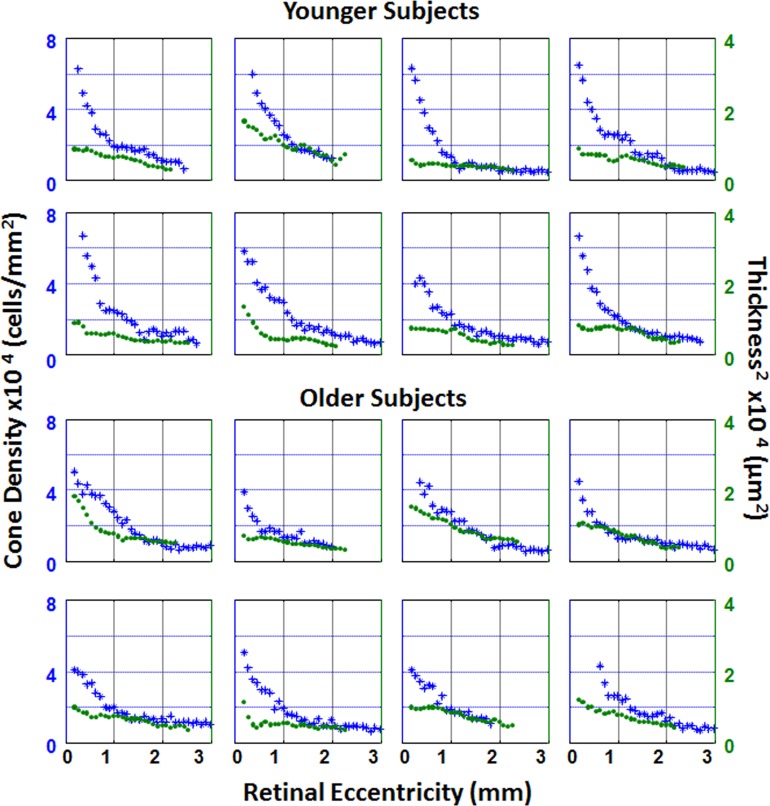
Figure 4.
Individual plots of cone density (blue asterisks) and ONL + HFL thickness2 (green circles) as a function of retinal eccentricity along the temporal meridian. The top two rows represent plots from younger subjects. The bottom two rows represent plots from older subjects.

