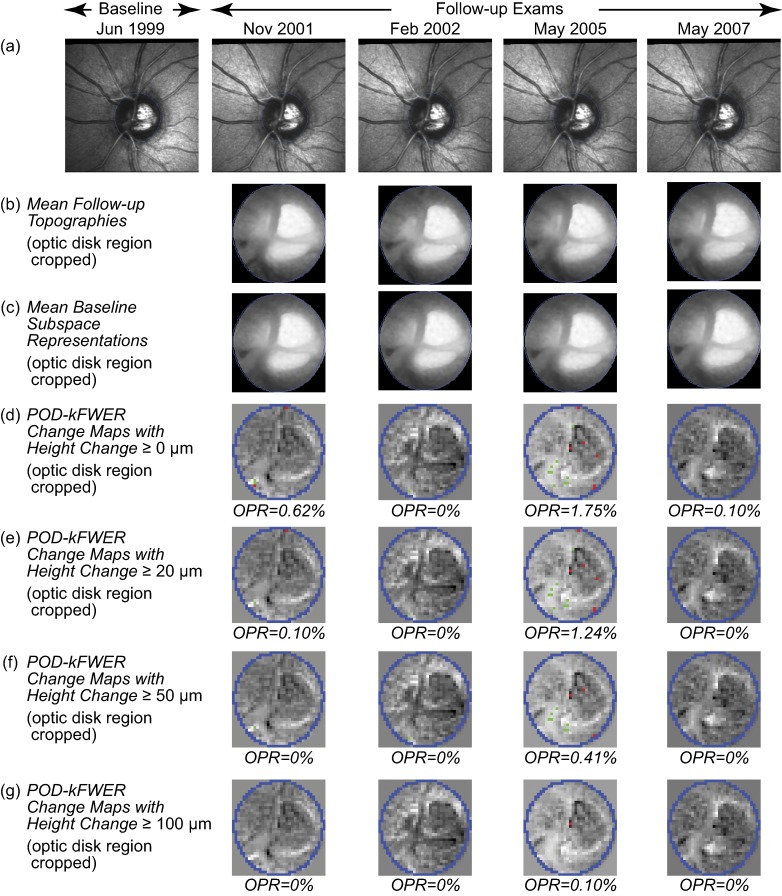
Figure 1.
POD k-FWER change significance maps of the example normal eye. Change maps indicate locations with likely glaucomatous changes (red superpixels) and treatment effects or improvement (green superpixels). (d–g) Optic disk region cropped for clarity; change maps indicate that no significant changes were detected from baseline (without any confirmation requirement). (e–g) Application of the minimum retinal height change criterion resulted in a slight reduction in the OPR.

