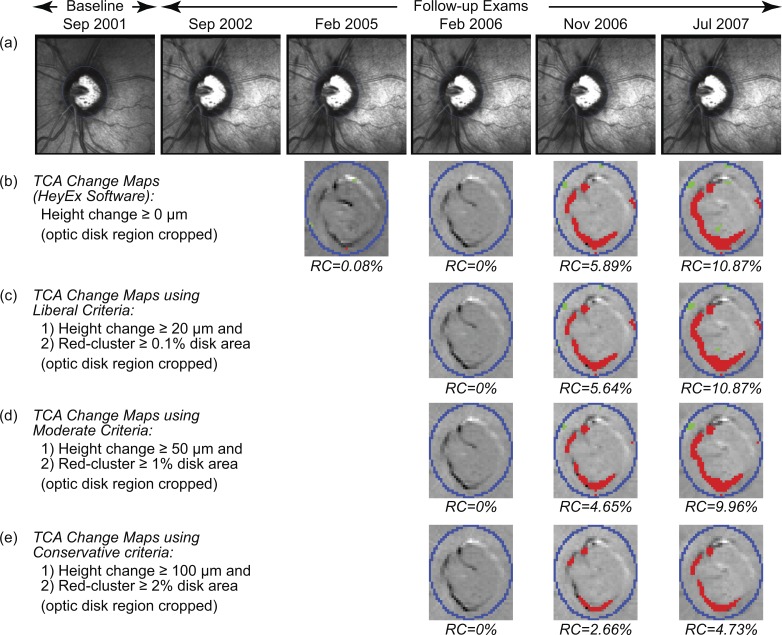
Figure 3.
TCA change significance maps of the example progressing eye as in the HRT TCA software (b), and using the liberal (c), moderate (d), and conservative (e) criteria of progression.4 The change maps (b–e; optic disk region cropped for clarity) indicate locations with likely glaucomatous changes (red superpixels) and treatment effects or improvement (green superpixels). (c–e) TCA detected significant glaucomatous changes (based on height change and red-cluster RC criteria) in the fourth follow-up exam in November 2006.

