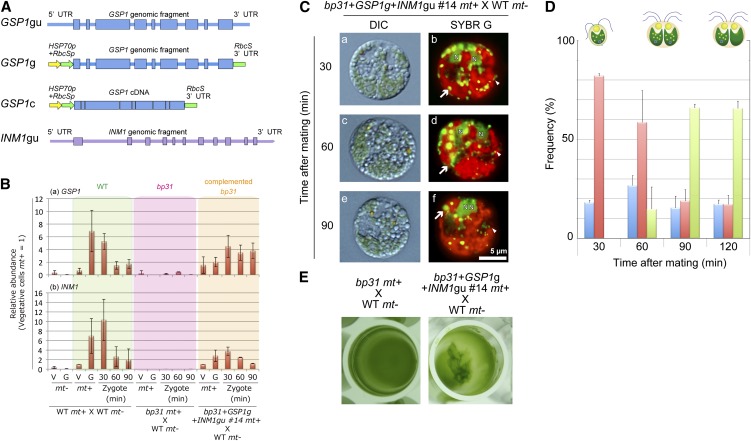
Figure 5.
The bp31 Mutation Was Complemented by Cotransformation with GSP1 and INM1.
(A) Schematic drawings of the expression constructs for GSP1 and INM1. A GSP1/INM1 genomic fragment including the 5′ and 3′ untranslated regions (UTRs) (GSP1gu/INM1gu); a GSP1 genomic fragment from the initiation codon to the termination codon ligated to the HSP70+RbcS promoter and RbcS 3′ untranslated region (GSP1g), and a GSP1/INM1 cDNA ligated to the HSP70+RbcS promoter and RbcS 3′ untranslated region (GSP1c/INM1c) were prepared.
(B) Comparison of the expression profiles of GSP1 and INM1. The cDNAs were prepared from the vegetative cells and gametes of mt− and mt+ cells (V−, G−, V+, and G+), and zygotes (30, 60, and 90 min after mating) and analyzed using qRT-PCR. The relative levels were normalized to the mt+ wild-type (WT) vegetative cells (normalized to 1).
(C) DIC ([a], [c], and [e]) and fluorescence ([b], [d], and [f]) images of SYBR Green I–stained young zygotes of bp31+GSP1g+INM1gu #14 mt+ × wild-type mt−.
(D) The frequencies of gametes (blue), zygotes with mt− cp nucleoids (red), and zygotes lacking mt− cp nucleoids (green) at 30, 60, 90, and 120 min after mating in bp31+GSP1g+INM1gu #14 mt+ × wild-type mt−.
(E) Pellicle formation in bp31 mt+ × wild-type mt− and bp31+GSP1g+INM1gu #14 mt+ × wild-type mt−.

