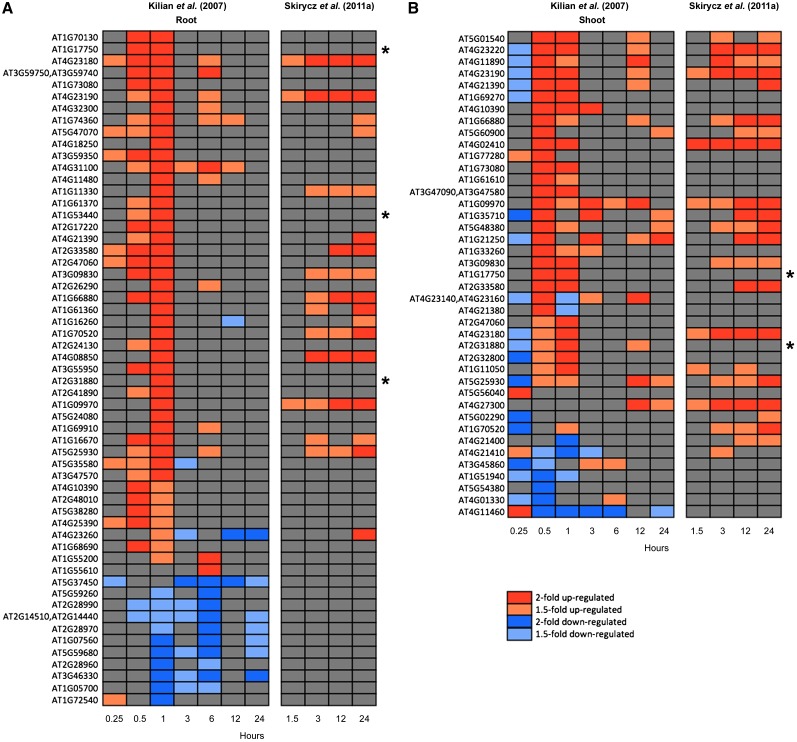
Figure 2.
Screen for Differentially Expressed RLK Genes in Arabidopsis.
Data were taken from a drought stress time series across root (A) and shoot (B) tissues (AtGenExpress; Kilian et al., 2007). In addition, data from a mannitol treatment for corresponding RLKs is shown (Skirycz et al., 2011a). Kilian et al. (2007) applied drought stress as follows: The plants were exposed to a stream of air in a clean bench for 15 min, which resulted in a loss of 10% of the plant’s fresh weight. Subsequently, plants were returned to the growth chamber and harvested at indicated time intervals. Skirycz et al. (2011a) used an experimental setup that reproducibly reduced the leaf area by ∼50%. Seedlings 9 d after stratification were transferred to 25 mM mannitol-containing medium (decreasing the water potential of the medium and, hence, water uptake of the exposed roots), and leaf primordia were harvested at indicated time intervals. The AtGenExpress drought microarray data set (Kilian et al., 2007) was downloaded from NASCArrays (Craigon et al., 2004) and then RMA normalized and analyzed using Bioconductor (Gentleman et al., 2004), which generated log2-fold changes across all of the probes. This list was filtered for 610 RLK family members (Shiu and Bleecker, 2001a). Blocks represent twofold upregulated (red), 1.5-fold upregulated (orange), twofold downregulated (blue), and 1.5-fold downregulated genes (light blue) in drought stress relative to control tissue. Asterisks indicate RLKs investigated by ten Hove et al. (2011), with T-DNA mutants displaying salt stress resistance.

