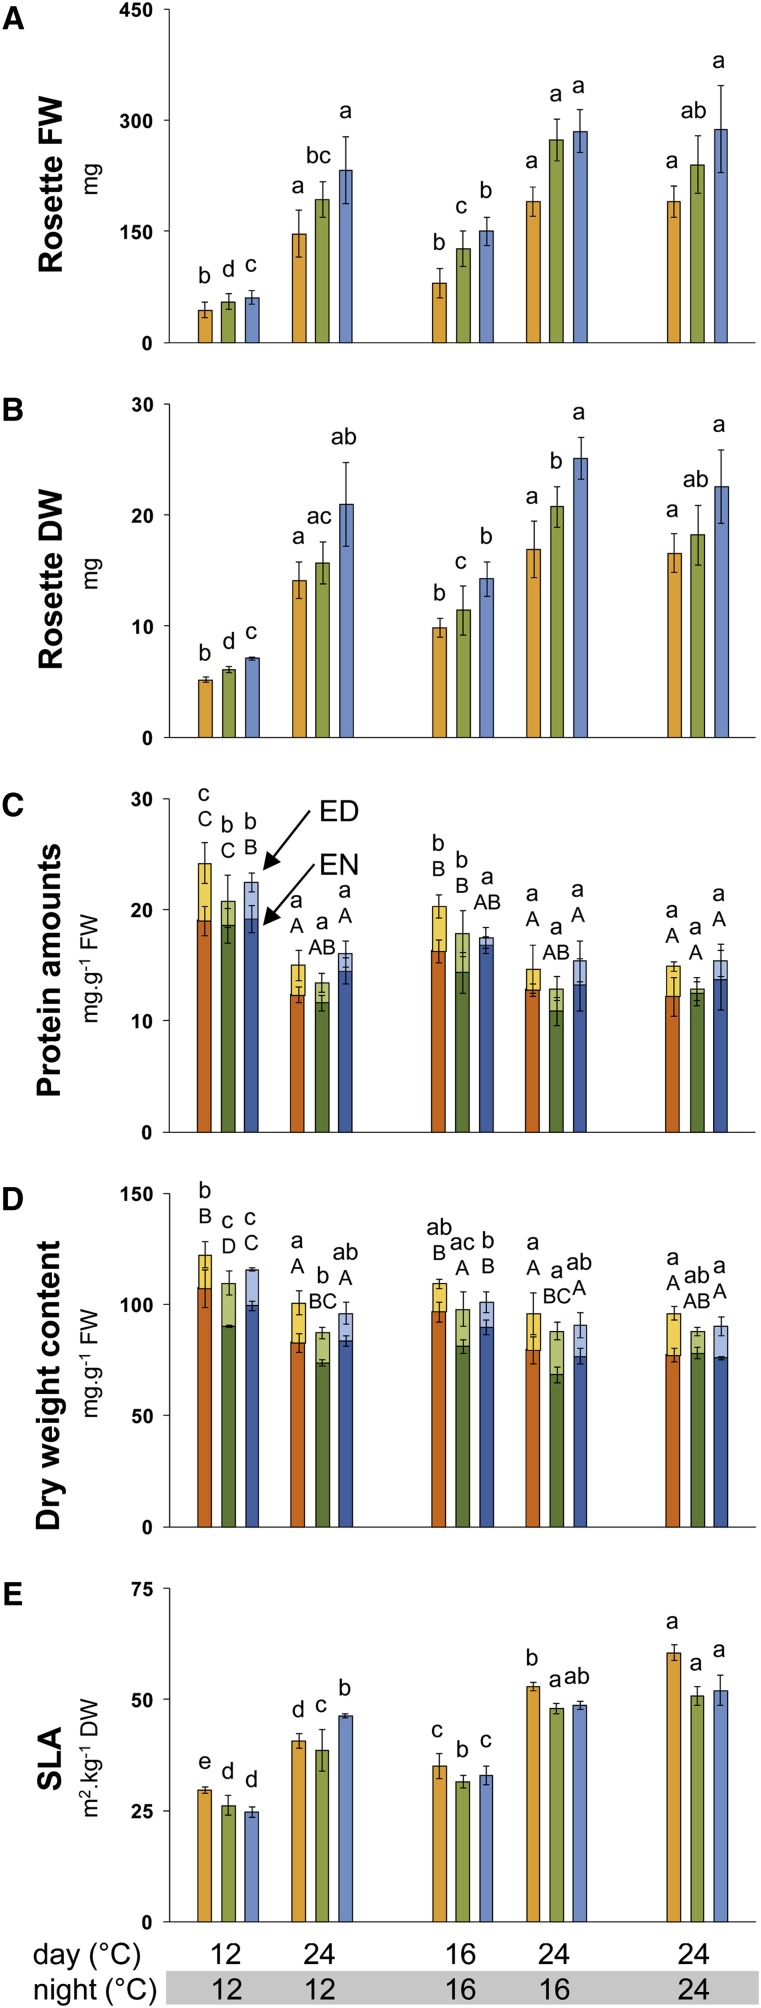
Figure 1.
Rosette FW, Rosette DW, Protein Amounts, DWC , and SLA of Three Accessions Grown in Five Different Thermocycles.
Rosette FW (A), rosette DW (B), protein amounts (C), DWC (D), and SLA (E). Bu-2, orange bars; Col-0, green bars; Lip-0, blue bars. Plants were grown in five different thermocycles: 12°C/12°C (day/night), 24°C/12°C, 16°C/16°C, 24°C/16°C, and 24°C/24°C. Data represent the mean ± sd (n = 4). For (C) and (D), light colors are for ED and dark ones for EN. One-way ANOVA was used to identify potential candidates for a statistically significant difference between treatments separately for each of the three accessions and two time points. After ANOVA P value correction using Holm’s method (P < 0.05), individual contrasts were then identified in a post-hoc Tukey HSD test (P < 0.05). Significant differences are indicated by different letters within the same time point (for [C] and [D], lowercase for ED and uppercase for EN). Original data are provided inSupplemental Data Set 2 online.

