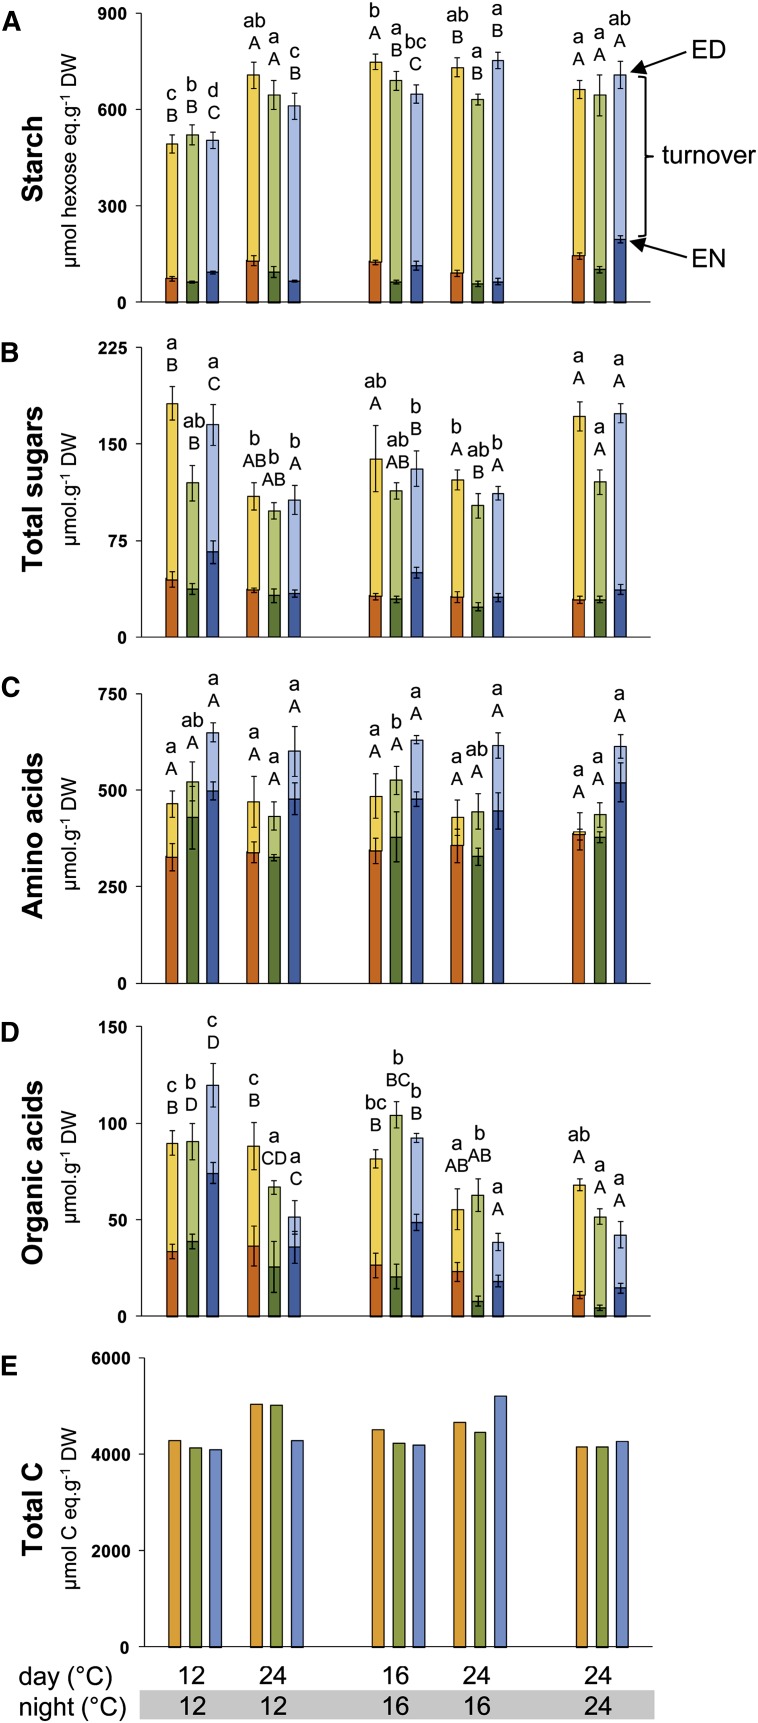
Figure 2.
Metabolite Levels on a DW Basis in Plants Grown in Five Different Thermocycles.
Bu-2, orange bars; Col-0, green bars; and Lip-0, blue bars. Determinations were made at ED (light color) and EN (dark color) for starch (A), total sugars (B), amino acids (C), organic acids (D), and total C turnover (E). Total C turnover is the sum of the C in starch, sugars, organic acids, and amino acids turned over during the night. Data represent the mean ± sd (n = 4). Error bars are absent for (E) as the calculation was based on average values. One-way ANOVA was used to identify potential candidates for a statistically significant difference between treatments separately for each of the three accessions and two time points. After ANOVA P value correction using Holm’s method (P < 0.05), individual contrasts were then identified in a post-hoc Tukey HSD test (P < 0.05). They are indicated by different letters within the same time point (ED, lowercase; EN, uppercase). Original data are provided inSupplemental Data Set 2 online.

