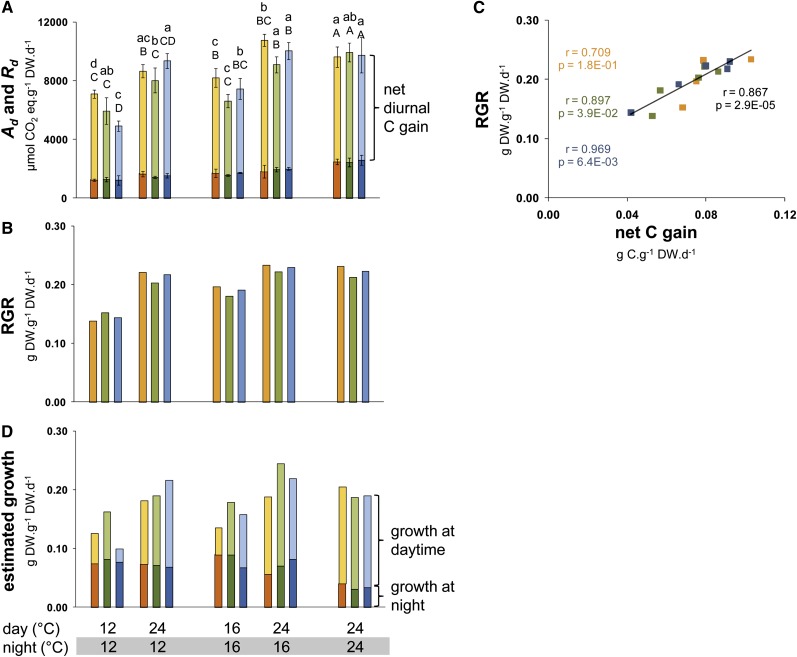
Figure 3.
Photosynthesis, Respiration, and Modeled Growth Rate in the Daytime and the Night on a DW Basis.
(A) Photosynthesis (A, pale color) and respiration (R, dark color) were measured at the growth temperature in five different thermocycles. The rates are shown on a per day basis, after correcting for the length of the light period (8 h) and the night (16 h). The net diurnal C gain is the difference between A and R.
(B) The RGR was estimated from the difference between biomass at harvest (Figure 2B) and biomass at transfer to the thermocycle treatments at 21 d.
(C) Correlation coefficient between the net diurnal C gain and RGR. Note that C accounts for ∼42% of the DW, so the numbers on the y axis must be multiplied by 0.42 to allow a comparison of the absolute rate of use of C for growth.
(D) Estimated rate of growth in the daytime and the night. The rate of growth in the day is estimated as A minus the sum of C accumulated in starch, sugars, organic acids, and amino acids (Figure 2E), divided by 0.42 (the proportion of C in DW). The rate of growth at night is estimated as the sum of C accumulated in starch, sugars, organic acids, and amino acids minus R, divided by 0.42.
Data represents the mean ± sd (n = 4), with one replicate comprising five pooled rosette plants. Orange, Bu-2; green, Col-0; blue, Lip-0. For details of the calculations, see Figure 2A; seeTable 1 andSupplemental Data Set 3 online. One-way ANOVA was used to identify potential candidates for a statistically significant difference in A and R between treatments separately for each of the three accessions and two time points. After ANOVA P value correction using Holm’s method (P < 0.05), individual contrasts were then identified in a post-hoc Tukey HSD test (P < 0.05). They are indicated by different letters within the same time point (ED, lowercase; EN, uppercase). Error bars and significance tests are absent for (B) and (D), where the calculations are based on average values for A, R, and summed C.

