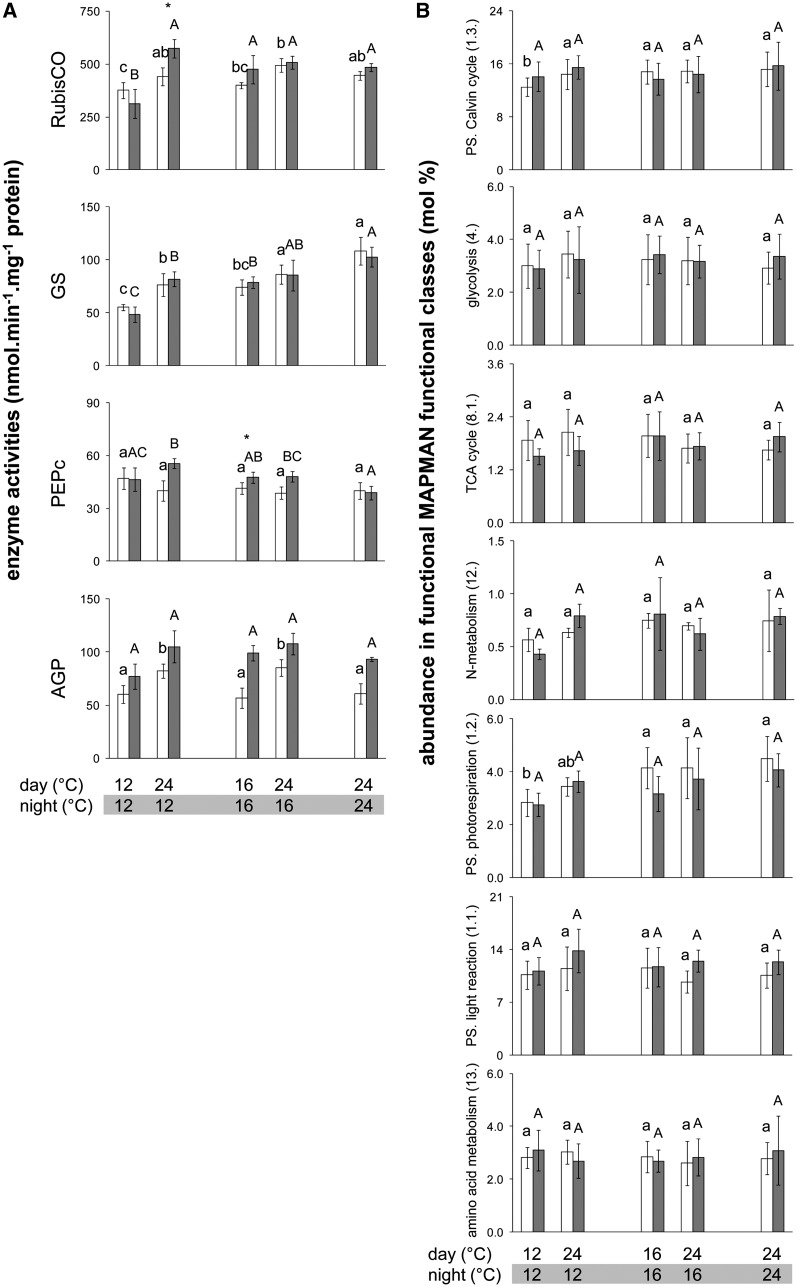
Figure 4.
Enzyme Activities and Protein Levels in Col-0 Grown in Different Thermocycles.
(A) Activities of four representative primary metabolism enzymes, determined at ED (open bars) and EN (closed bars). Activities are given on a protein basis (mean ± sd, n = 4). Significant differences between treatments were identified by ANOVA, followed by P value correction using Holm’s method (P < 0.05) and selection in a post-hoc Tukey HSD test (P < 0.05), and are indicated by different letters within the same time point (ED, lowercase; EN, uppercase). Comparisons between ED and EN using a paired t test at a given thermocycle are indicated by an asterisk if significant (P < 0.05). The complete data set containing 17 enzymes is available in theSupplemental Figure 3 online and all data are available inSupplemental Data Set 2 online.
(B) Qualitative variation in proteins comprised in seven major MapMan functional classes in rosettes of Col-0 plants grown in five different thermocycles. Data for each time point (ED, open bars; EN, closed bars) and thermocycle are expressed in mol % of proteins detected by LC-MS/MS. To get the relative abundance of each functional class at each time point and thermocycle, the relative abundance of each protein was summed. To calculate the standard deviations for each protein within a category, the global average across all thermocycles and harvest time points was calculated and all molar fractions were then expressed relative to this global average. By averaging these relative abundances (mol %) of all proteins belonging to a functional class, the standard deviation across all proteins within this functional class was determined and used to test for significant differences between all thermocycles and time points. Significant changes were identified as in (A) and are indicated by different letters within the same time point (ED, lowercase; EN, uppercase). Comparisons between ED and EN using a paired t test at a given thermocycle gave no significant differences. Graphs of three additional functional classes are shown in theSupplemental Figure 4 online. All raw data and information about the proteins analyzed are available inSupplemental Data Set 4 online. PS, photosynthesis.

