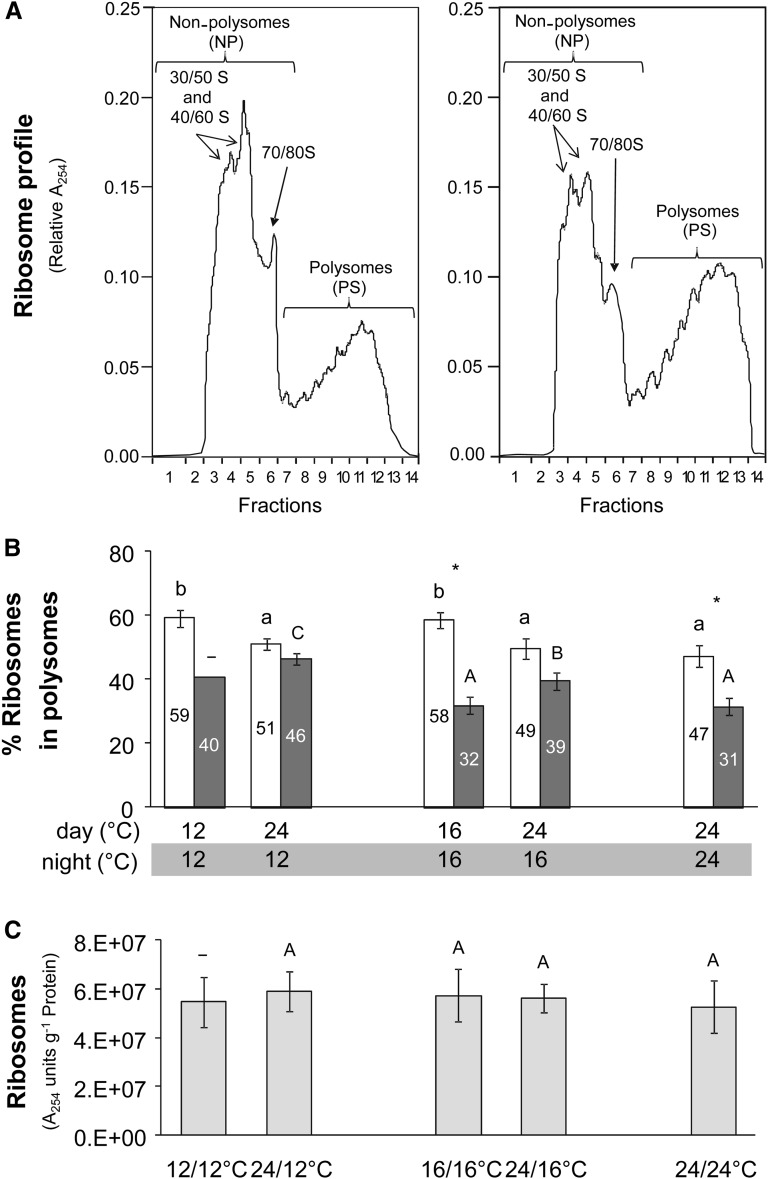
Figure 8.
Polysome Loading Analysis.
Polysome gradients were performed for Col-0 plants grown in five different thermocycles, harvested at ED (white bars) and EN (dark-gray bars).
(A) Examples of the distribution of ribosomes in fractions collected from a density gradient obtained from plants harvested at EN and grown in a 24°C/24°C (left panel) and 24°C/12°C (right panel) thermocycle. RNA was measured as absorbance at 254 nm (A254). Free ribosomes and monosomes are on the left-hand side and increasingly large polysomes toward the right-hand side of the display.
(B) Estimated proportion of ribosomes in polysomes. This is calculated as (PS)/(NP + PS). The percentage is given as numbers in the figure panel. The results are the mean ± sd (n = 3), except in the case of 12°C/12°C at EN, where n = 1.
(C) Ribosome content, estimated from the sum of the ribosome profile at A254. The average of the ribosome number at ED and EN was calculated for each treatment. The results are given as mean ± sd (n = 4). One-way ANOVA was used to identify potential candidates for a statistically significant difference between treatments. After ANOVA P value correction using Holm’s method (P < 0.05), individual contrasts were then identified in a post-hoc Tukey HSD test (P < 0.05). They are indicated by different letters within the same time point (ED, lowercase; EN, uppercase). In the case of 12°C/12°C at EN, this analysis was not possible due to lack of replication (n = 1). Comparisons between ED and EN using a paired t test at a given thermocycle are indicated by an asterisk if significant (P < 0.05).

