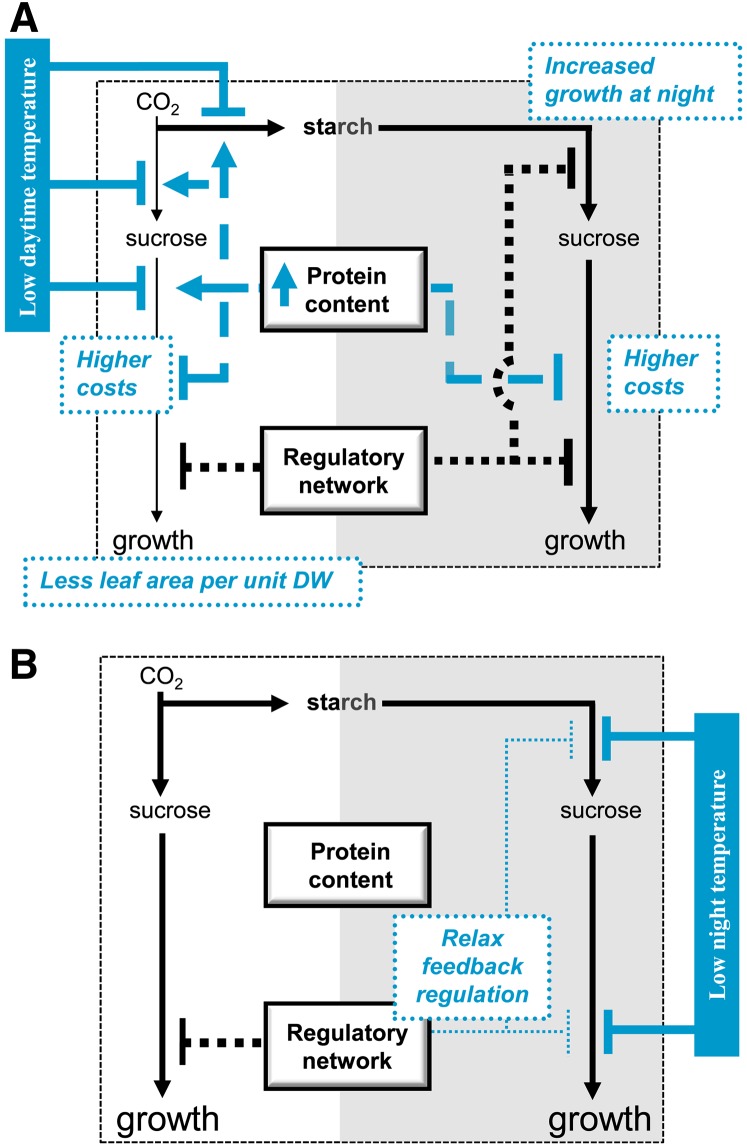
Figure 9.
Schematic Representation of the Effect of Growth Temperature on the Metabolism and Growth of Arabidopsis.
Pathways for C flow are indicated with solid lines, processes affected by a general increase in the protein content are indicated by dashed lines, and processes by clock-dependent regulation networks are indicated by dotted lines. Processes affected when the daytime (A) or the night (B) temperature is decreased are depicted in blue. External arrows indicate the direct effect of the decrease in temperature, and internal arrows the effect of acclimation of the protein content and adjustment of regulatory networks. The thickness of the lines, or the size of the letters, qualitatively depict the intensities. For simplicity, the effect of decreased maintenance respiration is not shown.

