Figure 1.
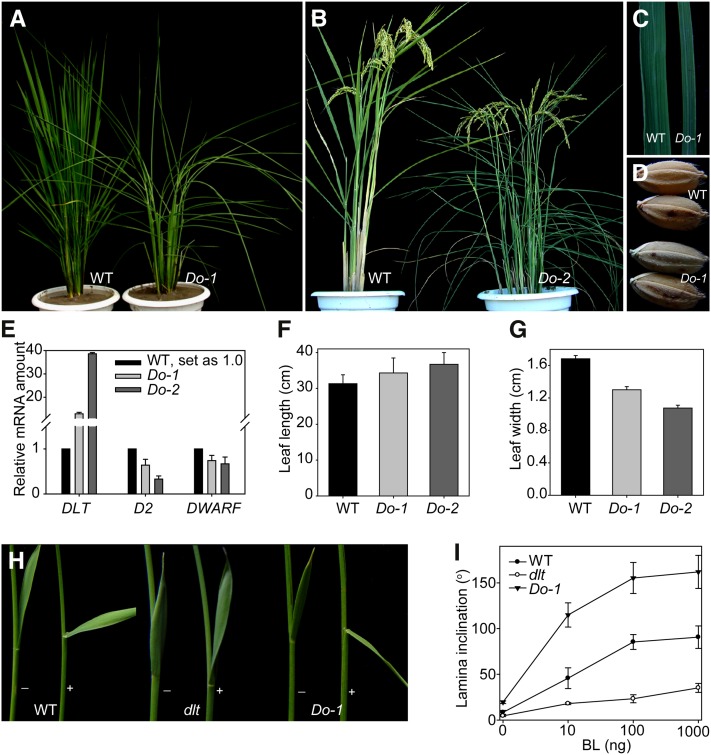
DLT Overexpression Plants (Do) Have Enhanced BR Signaling Phenotypes.
(A) and (B) Gross morphology of typical Do at vegetative phase (A) and at reproductive phase (B). WT, wild-type.
(C) Leaf width comparison between wild type and Do-1.
(D) Seed morphology of wild type and Do-1.
(E) qRT-PCR analysis of DLT, D2, and DWARF expression in Do compared with the wild type. Two-week-old seedlings were used for the analysis.
(F) and (G) Quantification of flag leaf length (F) and width (G) in Do compared with the wild type. Bars indicate sd (n = 12).
(H) BL sensitivity test of the wild type, dlt and Do-1 by lamina inclination experiments. The plus and minus symbols indicate with/without BL (100 ng).
(I) Quantification of the data in (H). Results using a range of BL amounts are shown. Bars indicate sd (n = 12).

