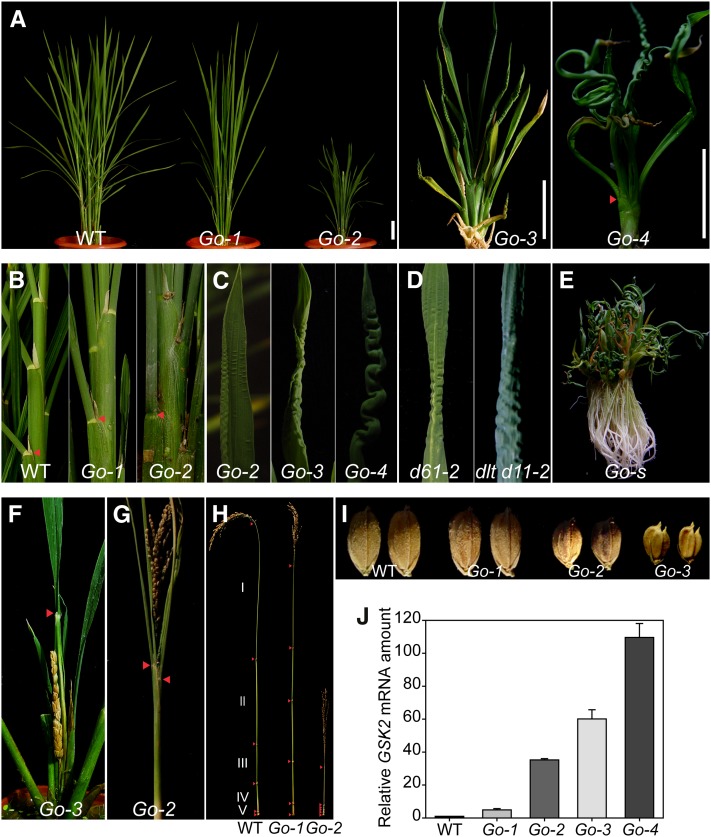
Figure 3.
Phenotypes of GSK2 Overexpression Plants (Go).
(A) Gross morphology of GSK2-1 overexpression plants arranged according to their phenotype severities (Go-1 to Go-4). Arrowhead indicates lamina joint. WT, the wild type. Bars = 5 cm.
(B) Close-up views of leaf angles of the wild type, Go-1, and Go-2. Arrowheads indicate lamina joints.
(C) Close-up views of increasingly severe frizzled leaf phenotypes in Go-2, Go-3, and Go-4.
(D) Frizzled leaf phenotype in d61-2 and dlt d11-2 mutants.
(E) A GSK2-1 overexpression plant with severe phenotypes (Go-s).
(F) A mature panicle enclosed in the flag leaf sheath. Arrowhead indicates the lamina joint of the flag leaf.
(G) Erect leaves and panicle of Go-2 at harvesting time. Arrowheads indicate lamina joints.
(H) Internode distribution of the wild type, Go-1, and Go-2. Arrowheads indicate nodes.
(I) Seed morphology of the wild type and Go-1 to Go-3.
(J) qRT-PCR analysis of GSK2 expression levels in different transgenic lines compared with the wild type. Flag leaves were used for the analysis.

