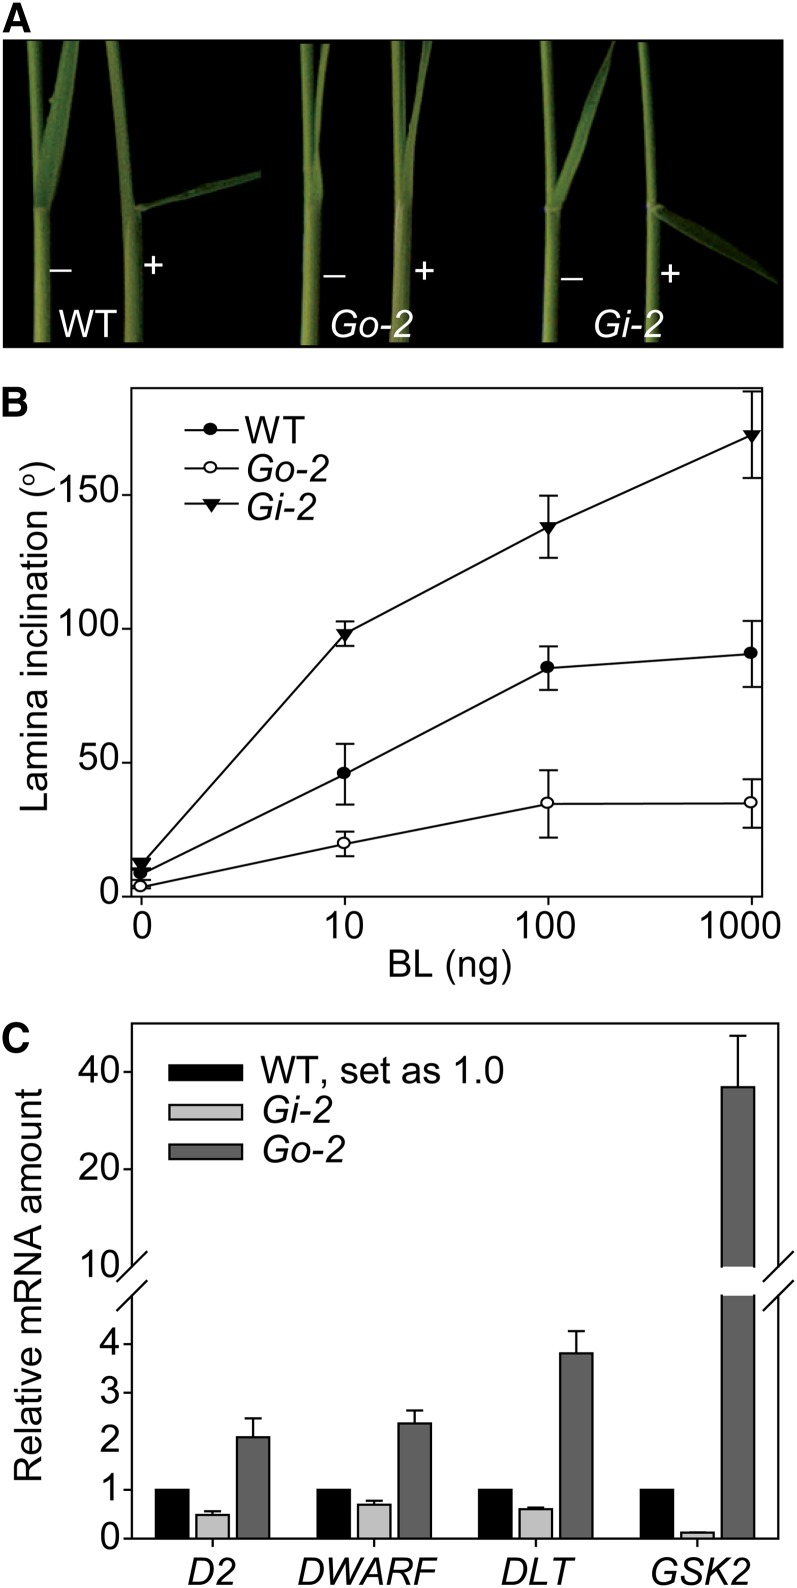
Figure 5.
Altered BR Sensitivity and BR-Related Gene Expression in Go-2 and Gi-2.
(A) BL sensitivity test of the wild type (WT), Go-2, and Gi-2 by lamina inclination experiment. The plus and minus symbols indicate with/without BL (100 ng).
(B) Quantification of the data shown in (A). Results using a range of BL amounts are shown. Bars indicate sd (n = 12).
(C) qRT-PCR analysis of D2, DWARF, DLT, and GSK2 expression levels in Go-2 and Gi-2 compared with the wild type. Flag leaves were used for the analysis.

