Figure 7.
nas4x-2 Flowers Showed Gene Expression and Morphology Phenotypes in Carpels and Stamens.
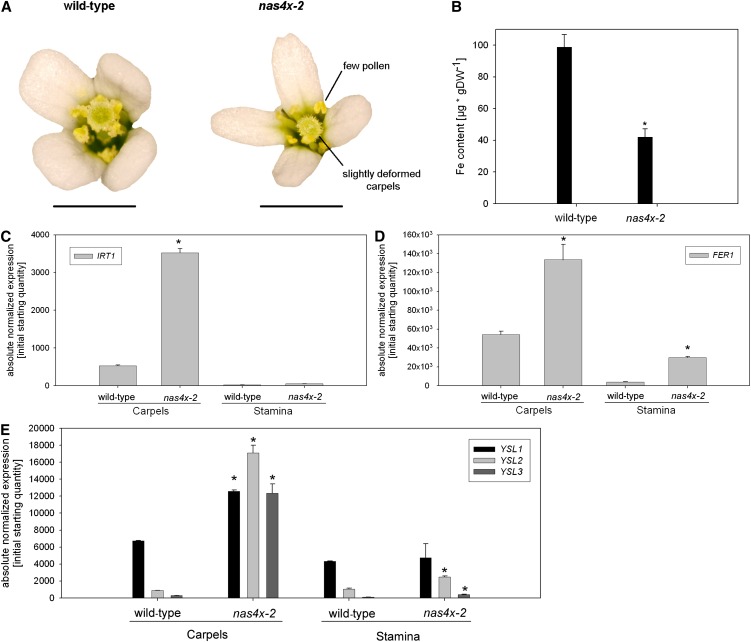
(A) Photographs of the morphology phenotypes of nas4x-2 flowers versus wild-type flowers.
(B) Fe contents of flowers, showing a decrease of total Fe content in nas4x-2 compared with the wild type (error bars are sd; n = 4; *P < 0.05). DW, dry weight.
(C) to (E) IRT1 (C), FER1 (D), and YSL1, YSL2 and YSL3 (E) gene expression levels in carpels and stamens, showing induction of IRT1 in carpels and an increase of FER1, YSL2, and YSL3 expression in carpels and stamens. Gene expression was determined by quantitative RT-PCR (error bars are sd; n = 3; *P < 0.05 for the comparison nas4x-2 versus the wild type).
[See online article for color version of this figure.]

