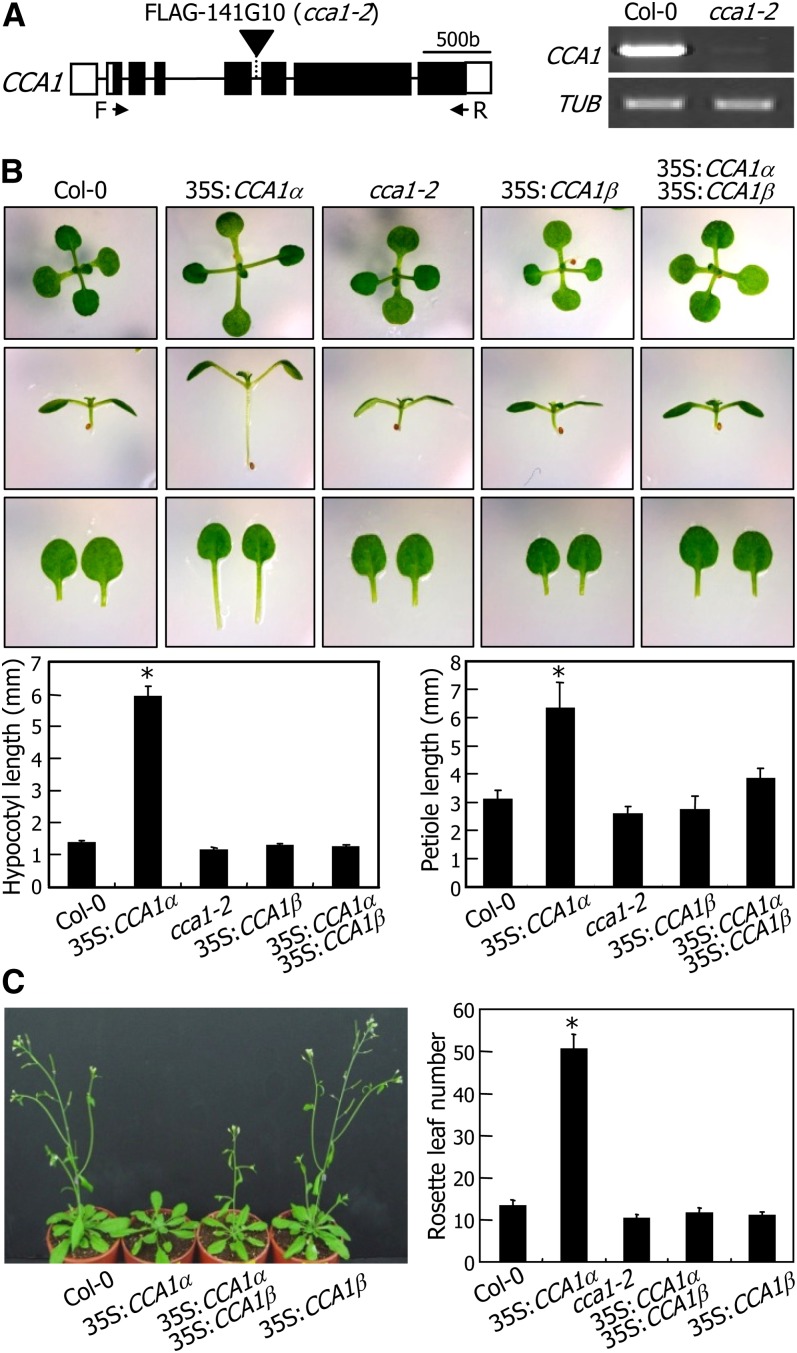
Figure 3.
Attenuation of CCA1α Activity by CCA1β.
(A) Mapping of T-DNA insertion in cca1-2 mutant. A single copy of the T-DNA element is inserted into the fifth intron of the CCA1 gene (left panel). Absence of CCA1 gene expression in the mutant was verified by RT-PCR (right panel) using the indicated forward (F/CCA1α-B1) and reverse (R/CCA1α-B2) primers. b, base pairs.
(B) Suppression of 35S:CCA1α phenotypes by CCA1β coexpression. Plants were grown on MS-agar plates for 3 weeks before photographs were taken (top panel). The lengths of hypocotyls (bottom left panel) and petioles (bottom right panel) of ∼30 plants were measured and averaged. Statistical significance was determined using a Student’s t test (*P < 0.01). Bars indicate the se.
(C) Flowering times. Five-week-old plants grown in soil were photographed (left panel). Rosette leaf numbers at bolting were counted using 30 plants and averaged for each plant genotype (right panel). Bars indicate the se (Student’s t test, *P < 0.01).

