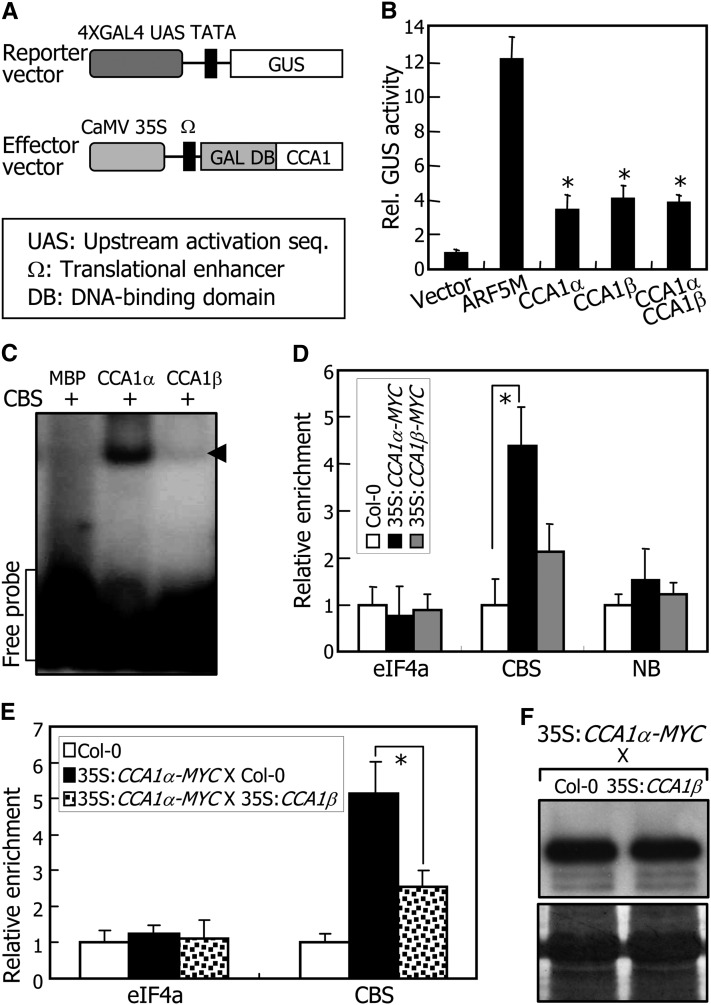
Figure 5.
Inhibition of DNA Binding of CCA1α by CCA1β.
(A) Reporter and effector vectors used in transient expression assays using Arabidopsis protoplasts. GAL4 transient expression assays were performed as previously described (Miura et al., 2007). The Renilla luciferase gene was used as an internal control to normalize values in individual assays.
(B) Transcriptional regulation activities of CCA1 isoforms. ARF5M is a transcriptional activator (Miura et al., 2007) and used as positive control. Five independent measurements of GUS activities were averaged. Statistical significance of the measurements was determined using a Student’s t test by comparing the vector control (*P < 0.01). Bars indicate the se.
(C) Electrophoretic mobility shift assays. Recombinant MBP-CCA1α (CCA1α) and MBP-CCA1β (CCA1β) fusion proteins and radiolabeled DNA were used. The CBS has been described previously (Pruneda-Paz et al., 2009). MBP alone was also included as a control in the assays. Arrows indicate protein-DNA complexes.
(D) ChIP assays. qRT-PCR primers were designed on the basis of the sequences flanking the CBS element of the CHE gene (Pruneda-Paz et al., 2009). The nonbinding site (NB) covering the region of 926 to 1035 bp downstream of the CBS element was amplified as a negative control. Three-week-old plants were used for the assays. Biological triplicates were averaged. The statistical significance of the measurements was determined using a Student’s t test by comparing with the values for CBS in Col-0 plants (*P < 0.01). Bars indicate the se.
(E) ChIP assays in 35S:CCA1α-MYC X 35S:CCA1β plants. Biological triplicates were averaged and statistically treated (t test, *P < 0.01). Bars indicate the se.
(F) Relative levels of CCA1α proteins. CCA1α proteins were detected immunologically using an anti-MYC antibody (top panel). Part of a Coomassie blue–stained gel is shown (bottom panel).

