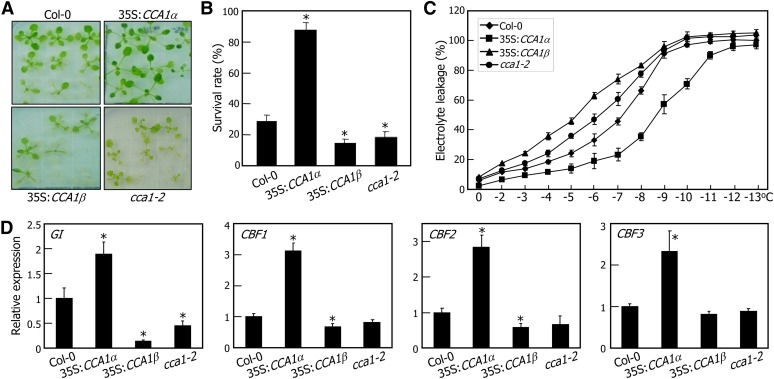
Figure 9.
Induction of Freezing Tolerance by CCA1α.
(A) and (B) Freezing tolerance assays. Two-week-old plants grown on MS-agar plates were incubated at −7°C for 5 h and allowed to recover at 23°C for 1 week before photographs were taken (A). Three measurements of survival rates, each consisting of ∼50 plants, were averaged (B). The statistical significance of the measurements was determined using a Student’s t test by comparing with the value of Col-0 plants (*P < 0.01). Bars indicate the se.
(C) Electrolyte leakage assay. Two-week-old plants grown on MS-agar plates were transferred to 4°C for 7 d under neutral day cycles and tested for freezing tolerance. Biological triplicates were averaged. Bars indicate the se.
(D) Expression of GI and CBF genes in CCA1-overexpressing plants. Plants grown on MS-agar plates under neutral day cycles for 10 d were transferred to continuous light conditions at 4°C. Whole plants were harvested at ZT48, and transcript levels were determined by qRT-PCR. Biological triplicates were averaged and statistically treated using a Student’s t test (*P < 0.01). Bars indicate the se.

