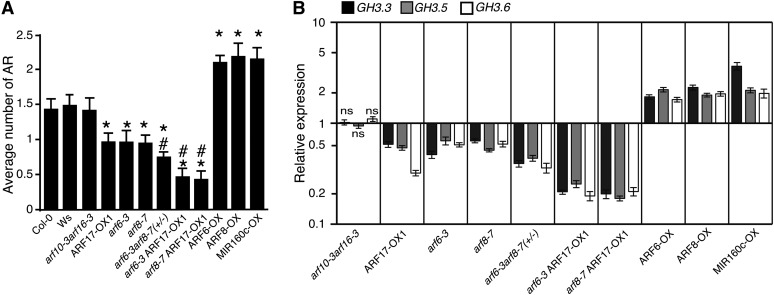
Figure 1.
Variation in the Number of Adventitious Roots in the Hypocotyl of arf Mutants and ARF-Overexpressing Lines Correlates with the Expression Levels of GH3.3, GH3.5, and GH3.6.
(A) Adventitious roots (AR) were counted on seedlings of arf mutant lines and ARF-overexpressing lines. Seedlings were first etiolated in the dark, until their hypocotyls were 6 mm long, and then transferred to the light for 7 d. Data from three independent biological replicates, each of at least 30 seedlings, were pooled and averaged. Error bars indicate se. A one-way analysis of variance combined with the Tukey’s multiple comparison posttest indicated that the values marked with asterisks were significantly different from wild-type values (P < 0.01; n > 90). In addition, those marked with hash signs were significantly different from values obtained from single mutants or the ARF17-OX1 line (P < 0.01; n > 90). Col-0, ecotype Columbia; Ws, ecotype Wassilewskija.
(B) The GH3.3, GH3.5, and GH3.6 transcript abundance was quantified in the hypocotyls of the different arf mutants or overexpressing lines, which had been etiolated and then transferred to the light for 72 h. Gene expression values are relative to expression in the wild type, for which the value is set to 1. Error bars indicate se obtained from three independent biological replicates. A one-way analysis of variance combined with the Dunnett’s comparison posttest indicated that the values marked with ns were not significantly different from wild-type values, whereas the others were significantly different (P < 0.05; n = 3).

