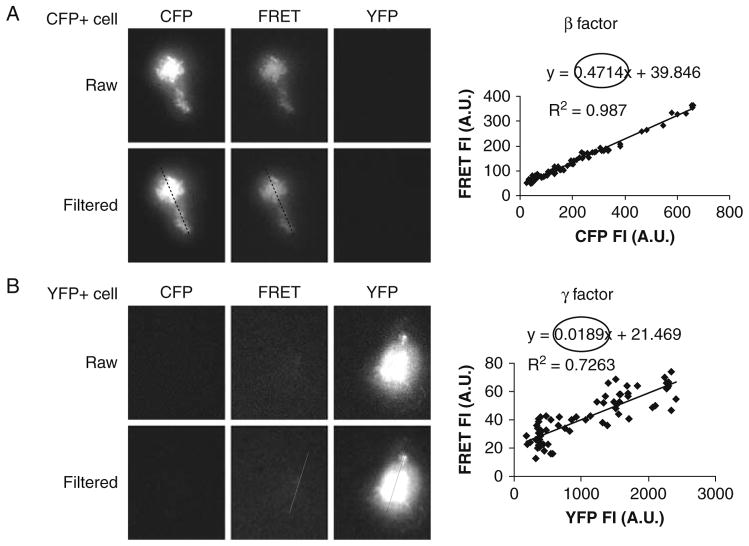
Fig. 10.1.
Determination of correction factors: (a) for CFP bleed-through (β) and (b) for YFP crosstalk (γ) from direct excitation of CFP and YFP by 442 nm laser, respectively. Cells expressing either Lyn-CFP alone (CFP+ cell) or Igα-YFP alone (YFP+ cell) were settled on planar lipid bilayer. Cells were excited sequentially with 442 and 514 nm laser light by TIRF microscope. Fluorescent emission was split through DualView to acquire CFP and FRET images (442 nm excitation) and the YFP image (514 nm excitation). Images were aligned, split to obtain raw CFP, FRET, and YFP images from the control cells, and then background subtracted and a Lo-pass filter applied (Filtered) as described in Section 3. To calculate β, intensity data was obtained from a line drawn over the same relative position in the cell in CFP and FRET filtered image and was plotted as FRET vs CFP (a) for each pixel in the line. β was determined from the slope of the line in the plot. γ (B) was calculated similarly using YFP and FRET filtered images. Similar results are obtained by averaging fluorescence intensities from several control cells.

