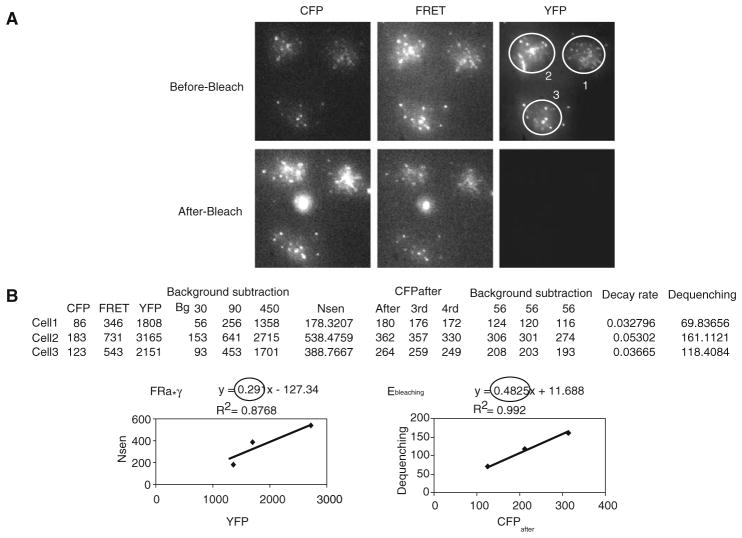
Fig. 10.2.
Determination of Ebleaching and Ka from Lyn16-CFP-YFP FRET positive control. (a) CFP, FRET, and YFP images before and after YFP photobleaching were acquired from cells expressing Lyn16-CFP-YFP on planar lipid bilayer and processed as described in Section 3. AOIs from three cells were drawn over cell contact areas from each image before (Pre-Bleach) and after bleaching (Post-Bleach). Note that images are not saturated on the 16 bit gray scale. (b) Procedure to obtain Ka from the CFP, FRET, and YFP images in a Microsoft Excel sheet is shown. Shown are a table containing the values that include background-subtracted YFP, Nsen, CFPafter and Dequenching, calculated from the mean fluorescence intensities of AOIs drawn in (a), and intensity plots for Nsen vs YFP and Dequenching vs CFPafter from the values of the table. FRa and Ebleaching were determined from the slope of the line of Nsen vs YFP and Dequenching vs CFPafter, respectively. Finally Ka was obtained from the equation (10).

