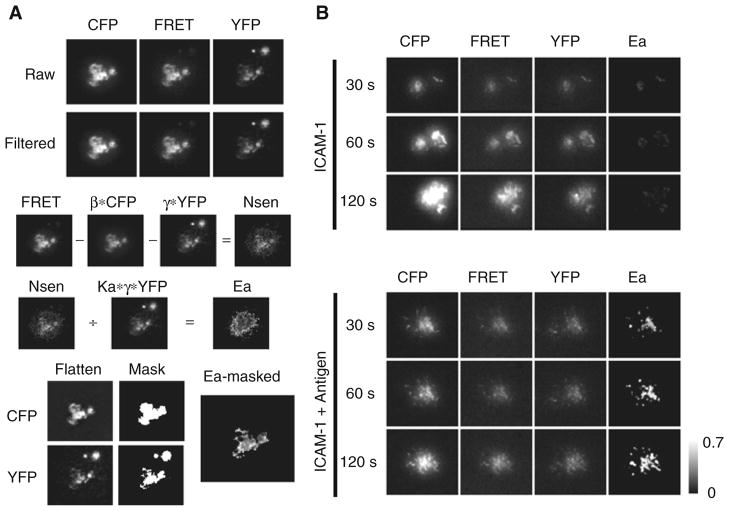
Fig. 10.3.
Membrane-bound-antigen-induced association of Lyn with BCR. Cells were dropped onto planar lipid bilayer with or without antigen and time-lapse images were acquired at 37°C for 15 min. (a) Procedure for image processing to obtain the FRET efficiency (Ea) image from experimental cells expressing both Lyn-CFP and Igα-YFP is shown. Images taken 1 min after cell contact to the antigen-bound membrane were processed and shown are the representative images in each step described in Section 3. β*CFP, γ *YFP, Ka* γ*YFP, N4sen and Ea images were obtained from pixel-by-pixel image calculation according to the appropriate equations. Raw; background-subtracted images, Filtered: Lopass-filtered images, Flatten: flatten-filtered images, Mask: masked images from flattened images, Ea-masked: masked image of Ea with both CFP and YFP masks. (b) CFP, FRET, YFP and Ea images at each indicated time after cell contact in the absence (ICAM-1) or presence of antigen (ICAM-1 + Antigen) on a planar lipid bilayer are shown. Images were processed as in (a) and shown are the filtered CFP, FRET, and YFP images and the masked Ea image. Ea is shown as gray scale is from 0 to 0.7. The fluorescence intensities of CFP, FRET, and YFP images are not comparable.

