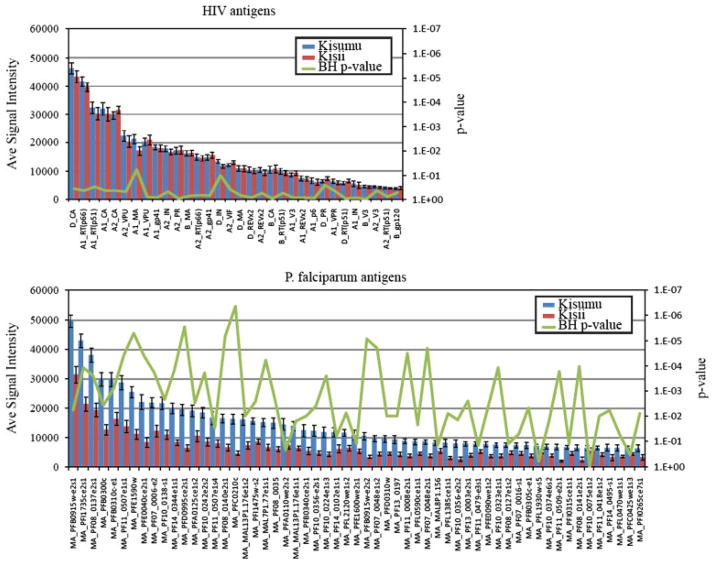
Figure 2.
Identification of differentially reactive antigens. The mean seroreactivity of each antigen was compared between unprotected and partially protected groups plotted red and blue, respectively, with SEM. “e” and “s” at the end of the genes refers to exon number and segment number. Corresponding p-values corrected for false discovery for each antigen are shown as a green line on the secondary axis. (A) The 64 seroreactive antigens are compared to the control HIV seroreactive ORFs and indicate that HIV seroreactivity was equal between groups. (B) Only the 64 seroreactive antigens are displayed and the corresponding locus tags are labeled on the x-axis.

