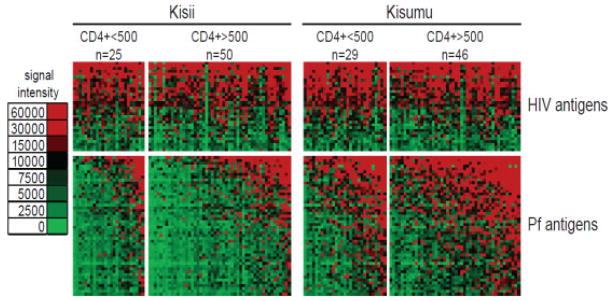
Figure 3.
Comparison of the seroreactivity between low and high CD4 counts within each group. Normalized antibody signal intensity against the 161 most seroreactive antigens are shown according to the colorized scale. (A) Individuals from Kisii (unprotected) and Kisumu (partial protection) are organized into groups of CD4 count below 500 and above. (B) 32 antigens were found to be differentially reactive (unadjusted for false discovery). These antigens are rows and are grouped according to differentially reactive and cross-reactive.

