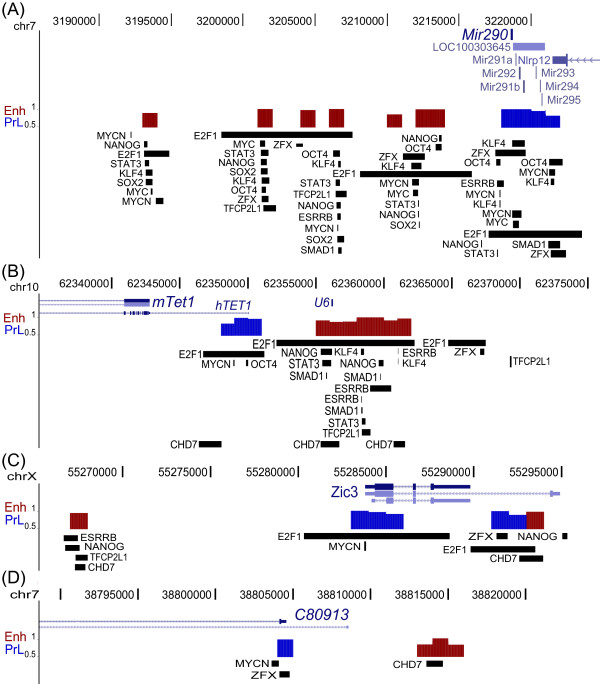
Figure 7.
Novel putative enhancer regions. Plot showing novel putative enhancers around miR-290(A), Tet1/U6(B), Zic3(C), and C80913(D). The Enh and PrL probabilities of 1 kb bins are shown in red and blue bars, respectively. Only bins with probabilities greater than 0.8 are displayed for higher stringency, and the y-axis scale is from 0.5 to 1. Transcription factors peaks identified using SISSRs algorithms are illustrated in rectangle boxes to demonstrate overlaps of the enhancers with TFs. mTet1: mouse Tet1 gene; hTET1: human Tet1 gene aligned to mouse mm9 genome.

