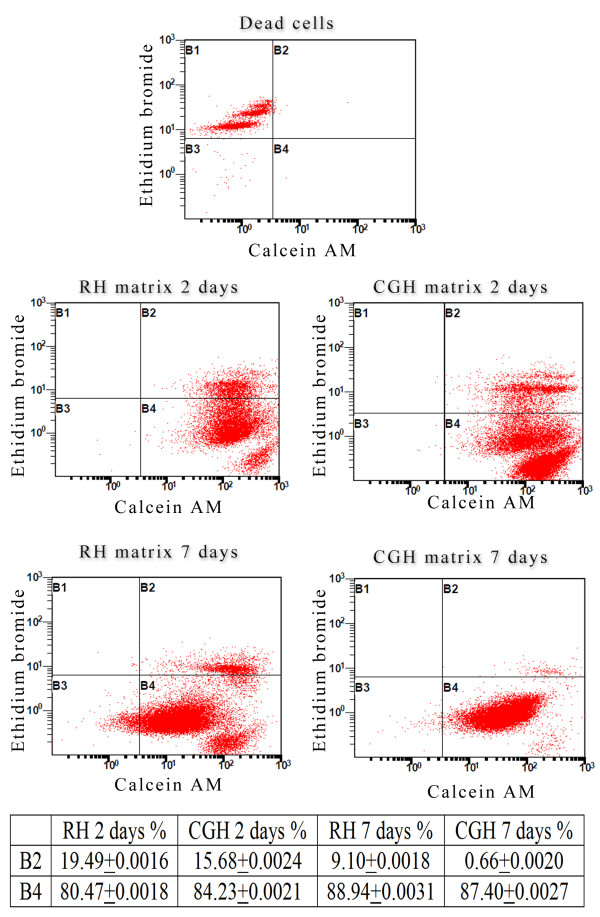
Figure 4.
Flow cytometric evaluation of hADSCs viability in both RH and CGH matrices. Fluorescence channel 1 (FL1)/Fluorescence channel 2 (FL2) plots showing Ethidium Bromide positive cells (B1), both Ethidium Bromide and Calcein AM positive cells (B2), unmarked debris (B3) and Calcein AM positive cells (B4).

