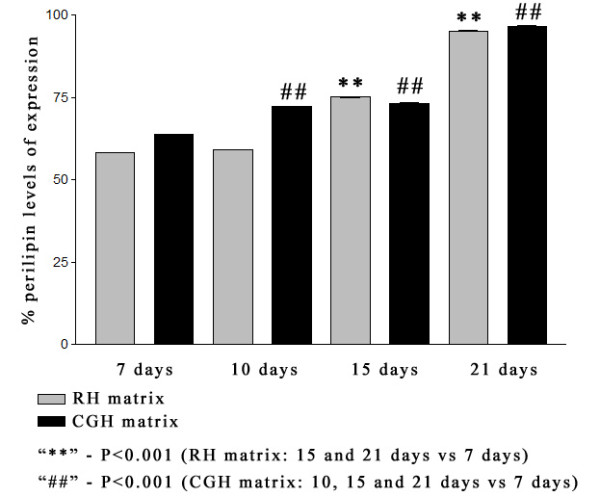
Figure 7.

Flow cytometric results showing the expression of perilipin in hADSCs embedded in alginate hydrogels during adipogenesis. The fluorescence level detected for perilipin in fluorescence channel 1 (FL1) was increasing in time for both 3D culture systems. Highly significant differences in perilipin expression levels were found at 21 days of induction compared to one week of adipogenesis, in both RH and CGH matrices. In RH matrix, lower values of fluorescence levels were recorded for 7 and 10 days of adipogenic induction as compared to CGH matrix. No significant differences between RH and CGH matrices were reported in perilipin expression after 2 weeks of adipogenesis. Results are presented as means ± SD (n = 3).
