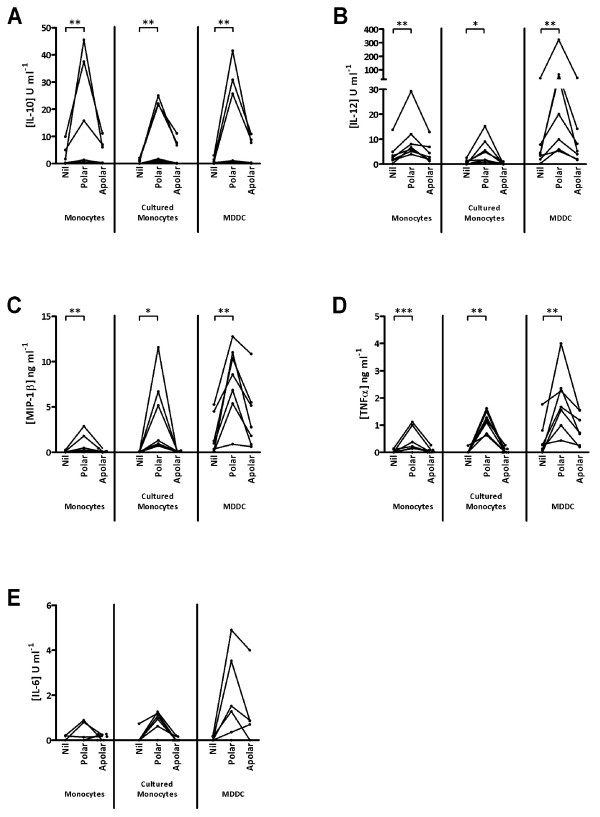
Figure 2.
IL - 10 (A), IL - 12 (B), MIP - 1β (C), TNFα (D) & IL - 6 (E) production by monocytes and cultured cells in response to stimulation with crude lipid fractions. Points represent mean responses from duplicate wells for each of 7 animals tested. Lines indicate that cells were derived from the same animal; * 0 < 0.05; ** p < 0.01; *** p < 0.001.

