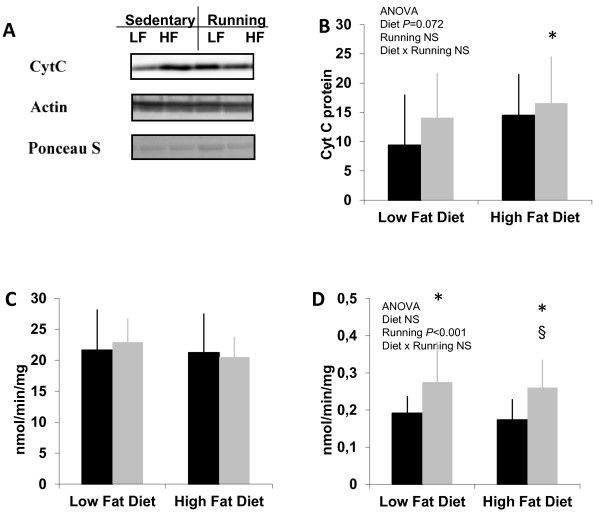
Figure 6.
Measures of estimated oxidative capacity in skeletal muscle. Cytochrome c (CytC) content in Western blotting (A) when normalized to Ponceau S (B) showed a trend of HF diet main effect (P = 0.072). n = 14–15 animals/group. The oxygen consumption of mitochondria (C) in QF muscle did not show any statistical difference between the groups. n = 10–12 animals/group. (D) Oxygen consumption in muscle homogenates was higher in the running groups than in the respective sedentary groups. n = 10–12 animals/group. * = vs. LFsed (P < 0.05), § = vs. HFsed (P < 0.05), NS = non-significant (P > 0.1). Black bars = sedentary, grey bars = running.

