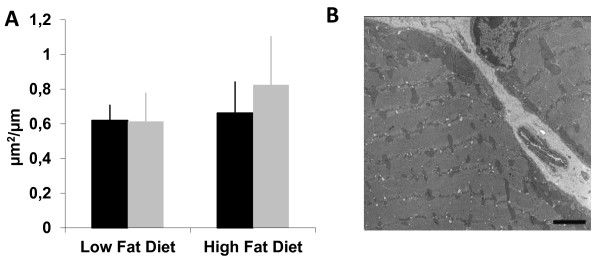
Figure 7.
Oxidative capacity estimated by electron microscopy. (A) There were no statistical differences between any of the groups in the area of subsarcolemmal mitochondria relative to the length of the sarcolemma when electron microscopic micrographs were analysed. n = 5 animals/group. Black bars = sedentary, grey bars = running. (B) Electron microscopic image from the subsarcolemmal mitochondria. Scale bar 2 μm.

