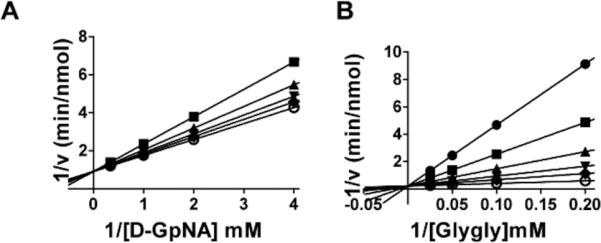
Fig. 7.

Kinetic analysis of GGT inhibition by Compound 20. Double-reciprocal plot of the initial velocity of the hydrolysis of D-GpNA in the presence of 0 (◆), 15.2 μM (▼), 31.25 μM (▲), 62.5 μM (■), 125 μM (●) Compound 20 (A). Double reciprocal plot of the initial velocity of the transpeptidation reaction with varying concentrations of glygly with 3 mM L-GpNA (B) in the presence of 0 (○), 15.2 μM (◆), 31.25 μM (▼), 62.5 μM (▲), 125 μM (▼), 250 μM (●) Compound 20. Data shown are average triplicate values ± S.D. For many data points the S.D. is smaller than the symbol.
