
Figure 1. Overall structure of Nef (cyan)–MHC-I CD (magenta)–μ1 (green) complex.
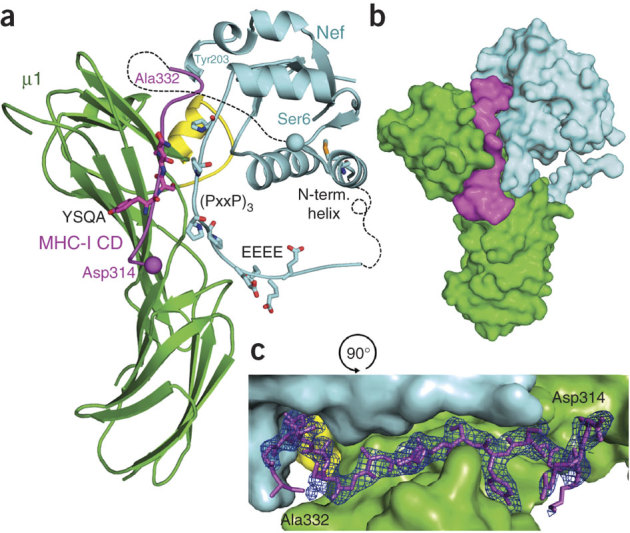
(a) Ribbon representation. (b) Surface representation. Previously unobserved region of μ1 is yellow. Key interaction motifs are shown as sticks and labeled. Spheres, membrane-attachment sites. Dashed lines, disordered linker region and Nef N-terminal loop. (c) Experimentally phased (SAD) electron density map (1 σ level) of the MHC-I CD (sticks) in a close-up view rotated 90° from that in a,b.