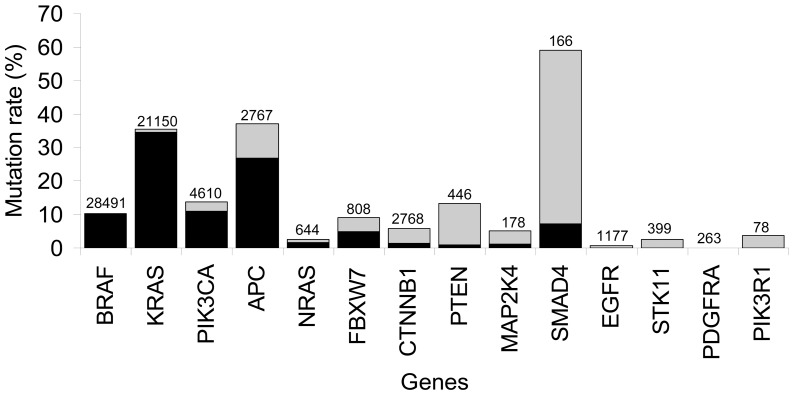
Figure 1. Total coverage of the 14 genes investigated, based on the COSMIC database.
On the x-axis the analyzed gene. On the y-axis the mutation percentage is shown, based on large intestine carcinomas in the COSMIC database. In grey, the mutation percentages according to the COSMIC database, in black the mutation percentage covered by this study, on top of the bars the total number of analyzed samples found in the COSMIC database.

