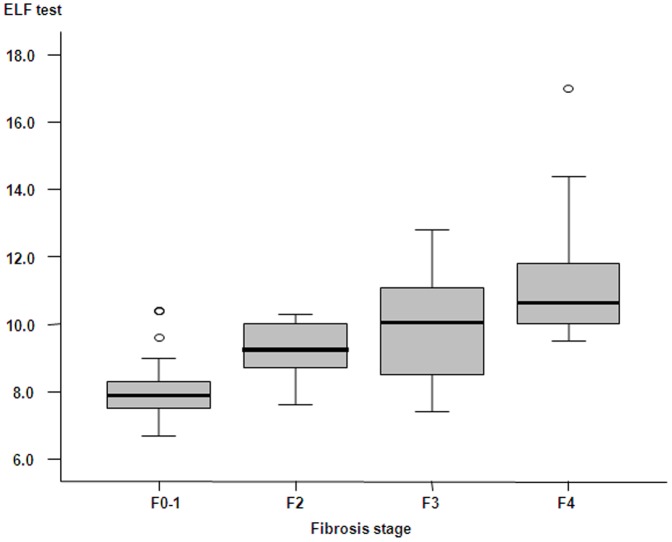
Figure 2. Box plots of ELF test according to fibrosis stage.
Boxes and horizontal lines within boxes represent interquartile ranges (IQRs) and median values, respectively. The upper and lower whiskers indicate 75th percentile plus 1.5 IQR and 25th percentile minus 1.5 IQR, respectively. o, mild outlier: a value more than 75th percentile plus 1.5 IQR, but less than 75th percentile plus 3.0 IQR.

