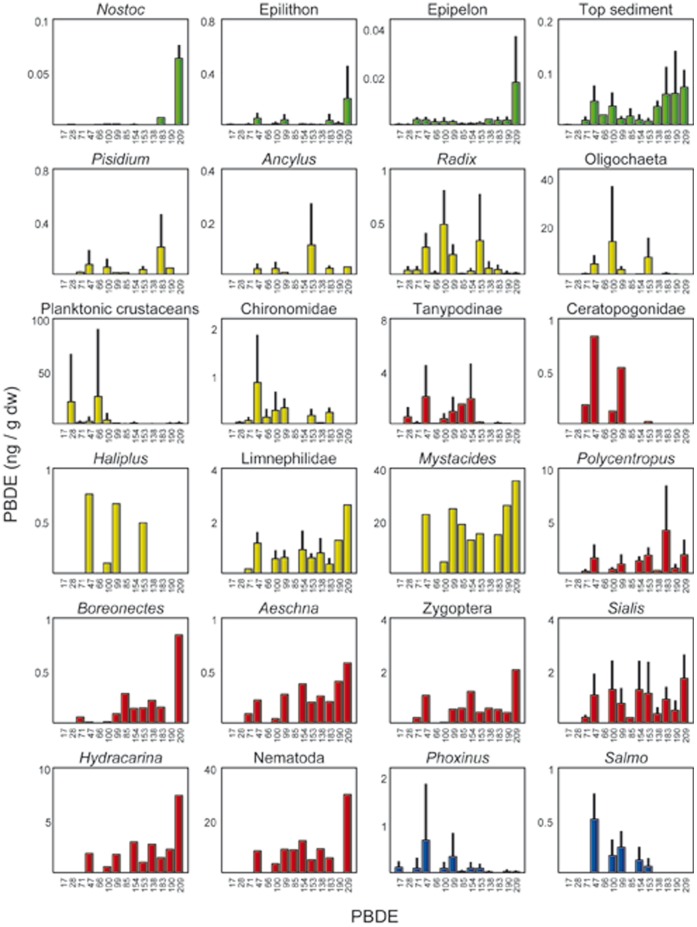
Figure 2. PBDE content in individual taxa and assemblages of the lake food webs studied.
Mean and standard deviation are indicated, if more than one sample was available. The complete list of measured values is provided as Table S1. Bar colors correspond to basal resources (green), primary consumers (yellow), secondary consumers (red), and fish (blue). Error bars correspond to standard deviation of the whole number of samples analyzed for a given species or assemblage.

