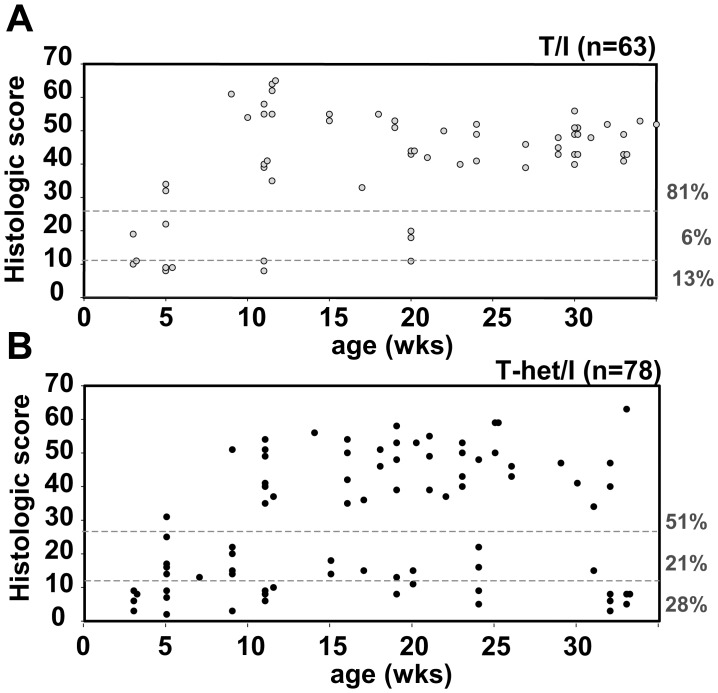
Figure 2. Spontaneous colitis in T/I and T-het/I mice.
The colon histologic score is shown as a function of age for T/I (panel A) and T-het/I (panel B) mice. Each dot represents a single mouse studied. Dashed lines divide mice into groups with no colitis (histologic score ≤12), mild colitis (histologic scores between 13 and 24), and moderate to severe colitis (histologic score ≥25). The percentage of mice in each of these severity categories is shown at the right of each figure. Significantly fewer T-het/I mice had moderate to severe colitis compared with T/I mice (p = 0.0004; relative risk 0.39, 95% confidence interval 0.22–0.68).

