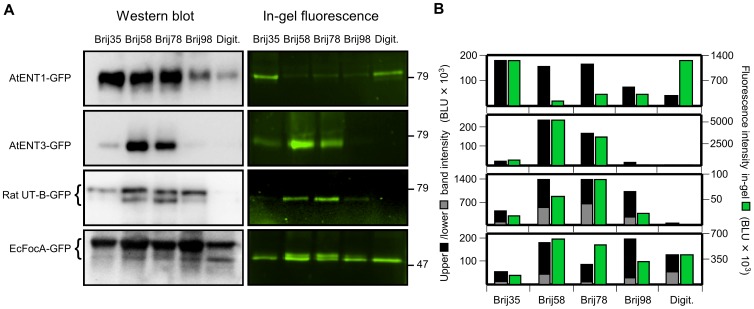
Figure 3. Semi-quantification of protein yield and in-gel GFP fluorescence of representative membrane protein-GFP fusions.
A. Shown are Western blot (left panel) and in-gel fluorescence signals (right panel) of GFP fusions with Arabidopsis nucleoside transporters, AtENT1 and AtENT3, the rat urea transporter B, UT-B, and the E. coli formate transporter, EcFocA, after cell-free synthesis in the presence of various detergents of the Brij-type and digitonin (Digit.). For membrane protein characteristics see text. The molecular weight of marker proteins is indicated on the right. B. The black and gray bars represent intensities of the upper and lower band from the Western blot and the green bars those of the in-gel GFP fluorescence. The intensity units are arbitrary (BLU – biomedical light units). The differences in scale of the ordinates derive from different exposure times used in the individual experiments.

