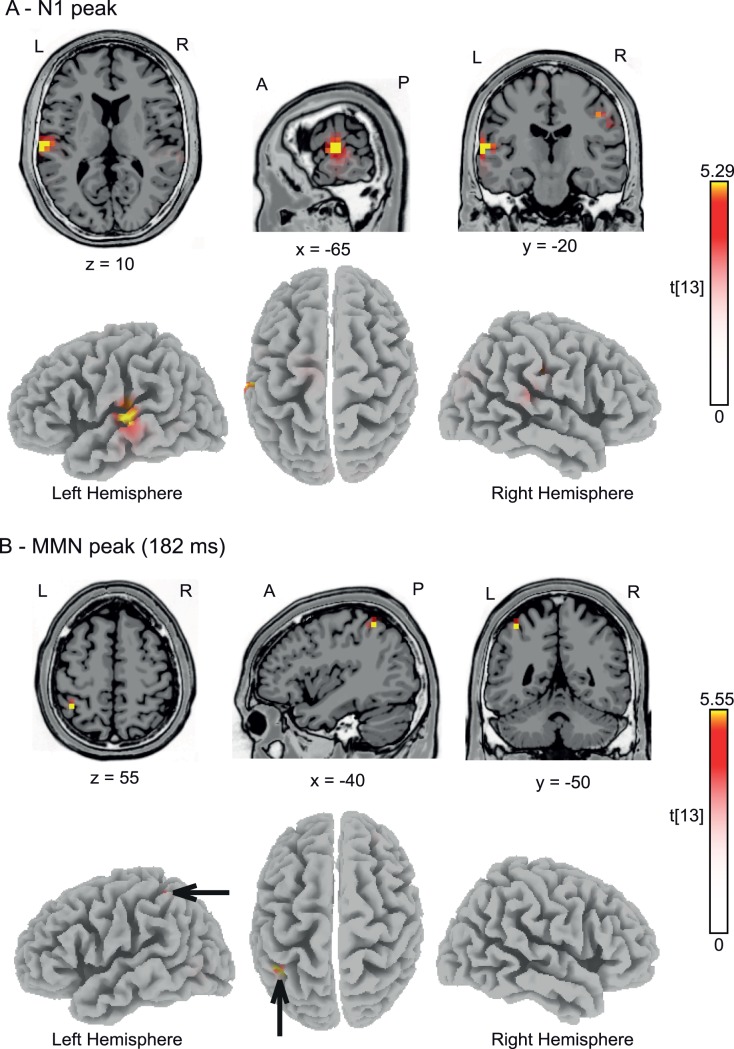
Figure 3. Source localization.
(A) sLORETA source reconstruction for the N1 component of the craniocentric deviants versus standards (measured in trials preceding the craniocentric deviants). Functional data from all subjects were projected onto the standard 3-D MNI brain template “Colin” of sLORETA. Red and yellow color coding indicates t-values with statistically significant activation for deviants compared to standards at t≥5.29; p<0.05, corrected for multiple comparisons. (B) sLORETA source reconstruction for the craniocentric deviant compared to standards for time points with maximal MMN (mean: 182 ms). Red and yellow color coding indicates t-values with statistically significant activation for deviants compared to standards (t≥5.55; p<0.05, corrected for multiple comparisons). Black arrows point toward significant regions in the left inferior parietal lobule. A, anterior; P, posterior; L, left; R, right. The x, y, and z-values indicate the position of the sagittal, coronal and horizontal slices in MNI-coordinates.

