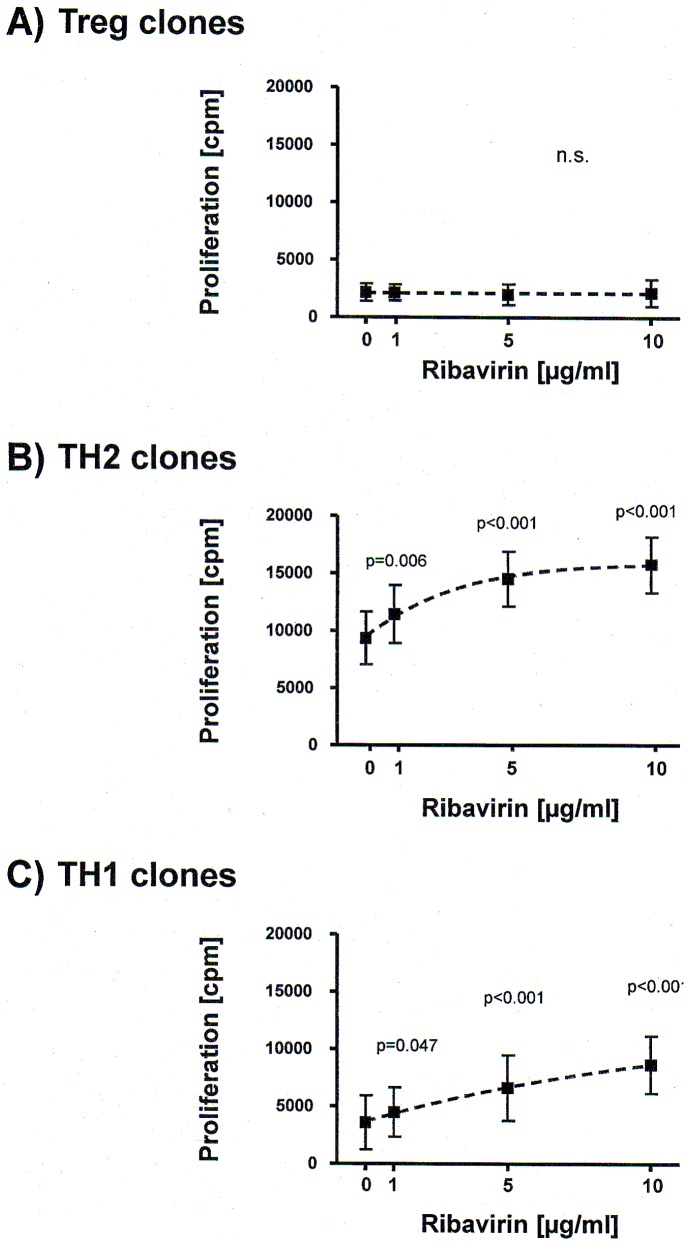
Figure 2. Effect of ribavirin on proliferation of differentially polarized CD4+ T cell clones.
Figure 2 shows dose response curves of proliferation ([3H] thymidine uptake, cpm = counts per minute; mean ± SEM) versus ribavirin concentrations (0, 1, 5 and 10 µg/ml) in anti-CD3/anti-CD28-activated Treg clones (A; n = 7), TH2 clones (B; n = 8) and TH1 clones (C; n = 7). Response curves were obtained by a non-linear curve fit with the GraphPad Prism Response Curve module (GraphPad Prism 4 Software, San Diego California, USA). Statistical significance was calculated by 1-way ANOVA with correction for repeated measurements.

