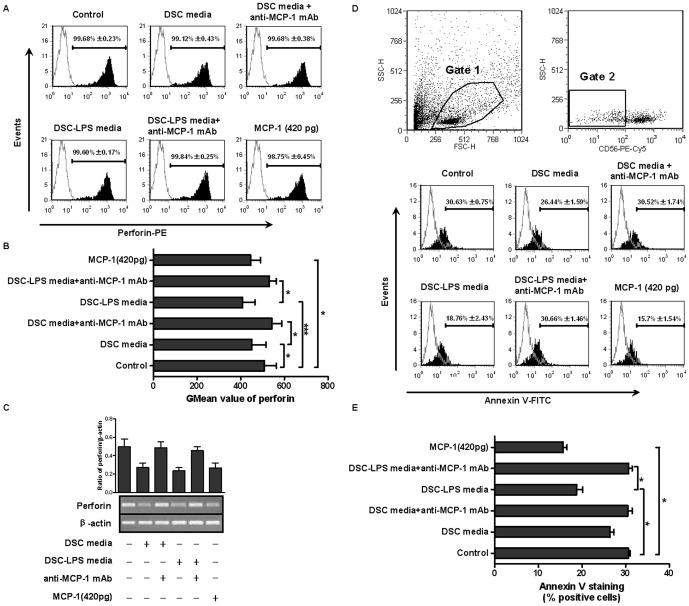
Figure 4. DSC-derived MCP-1 was involved in the inhibition of perforin expression in CD56+ NK cells.
Freshly isolated CD56+ NK cells were stimulated with DSC media, DSC-LPS media or MCP-1 (420 pg/mL, according to the mean level of 16 DSC-LPS media detected by ELISA) for 48 hours. An anti-MCP-1 neutralizing mAb was added to the cultures 1 hour prior to the stimulation, and the perforin expression was analyzed by flow cytometry and RT-PCR. (A) Flow cytometric analysis of perforin. The picture is from a representative experiment, and the numbers are the percentages of positive cells. (B) GMean value of perforin expression. (C) A representative graph of perforin mRNA expression detected by RT-PCR. Respective density analysis of the bands normalized to β-actin bands. (D) Flow cytometric analysis of apoptosis of K562 cells induced by NK cells. NK cells indifferent treatment conditions were incubated with K562 (NK∶ K562 ratio: 1∶4) for 5 hours. The cytotoxicity of he NK cells was evaluated based on the percentage of CD56-negative (K562 cells) annexin V-positive cells as previously described. Gate 1, cells involved in our analysis. Gate 2, CD56-negative cells. (E) Graphs represented percentage of annexin V-positive cells. All data shown were expressed as mean±SD of 3 independent experiments. *P<0.05 and *** P<0.0001.

