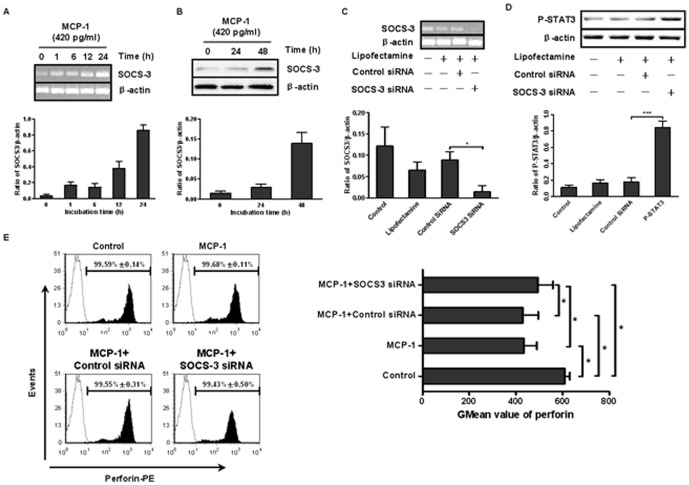
Figure 5. MCP-1 inhibited perforin production in NK cells by up-regulating SOCS3 expression.
Isolated CD56+ NK cells were transfected with control siRNA or SOCS3 siRNA (at a final concentration of 1 µM) for 48 hours. (A) NK cells with SOCS3 silencing were treated with rMCP-1 (420 pg/mL). The mRNA expression of SOCS3 at different points was detected by RT-PCR, and the respective density was analyzed. (B) The effect of MCP-1 on protein expression of SOCS3 at 0 hours, 24 hours and 48 hours was detected by western blot, and the respective density was analyzed. (C) and (D) 48 hours after siRNA transfection, the efficacy of SOCS3 siRNA was evaluated. The expression of SOCS3 mRNA was detected by RT-PCR, and the expression of SOCS3 protein was indirectly examined by phospho-STAT3 detection. Increased phospho-STAT3 levels represented a reduction of SOCS3 expression. An analysis of the respective densities of the bands normalized to β-actin bands was conducted. (E) Transfected NK cells were stimulated with MCP-1 (420 pg/mL) for 48 hours, and the perforin expression was analyzed by flow cytometry. The percentages of perforin-positive cells and their corresponding GMean values are presented in the figure. All of the graphs are representive, and all data shown are expressed as the mean±SD of 3 independent experiments. *P<0.05.

