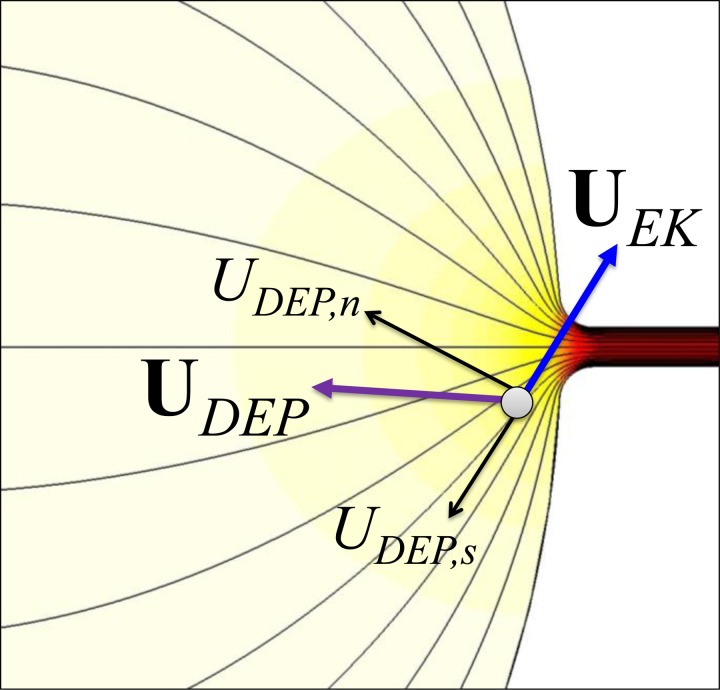
Figure 2.
Illustration of cell velocity at the reservoir-microchannel junction due to the combined effects of electrokinetic flow, UEK, and negative rDEP, UDEP. The thin lines represent the electric field lines or equivalently fluid streamlines. The background color shows the electric field contour (the darker color, the larger field magnitude).

