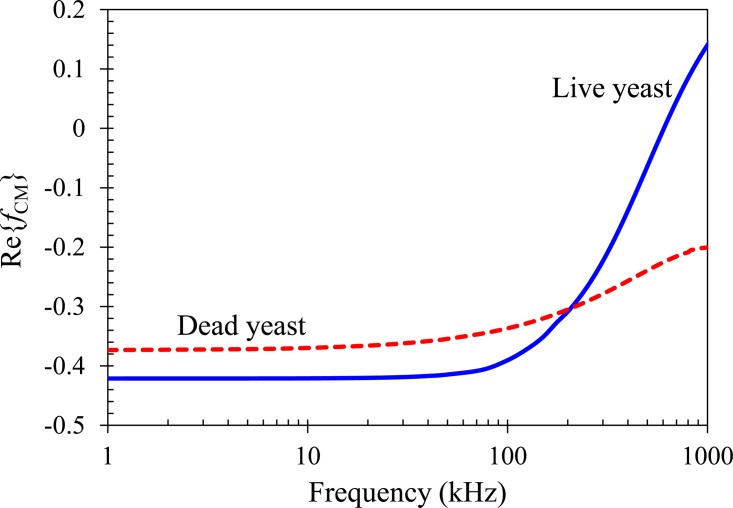
Figure 3.
Comparison of the model predicted CM factors of live (solid line) and dead (dashed line) yeast cells suspended in 1 mM phosphate buffer as a function of the electric field frequency. The dashed-dotted line divides the diagram to positive DEP (top half, Re{fCM} > 0) and negative DEP (bottom half, Re{fCM} < 0) regions.

