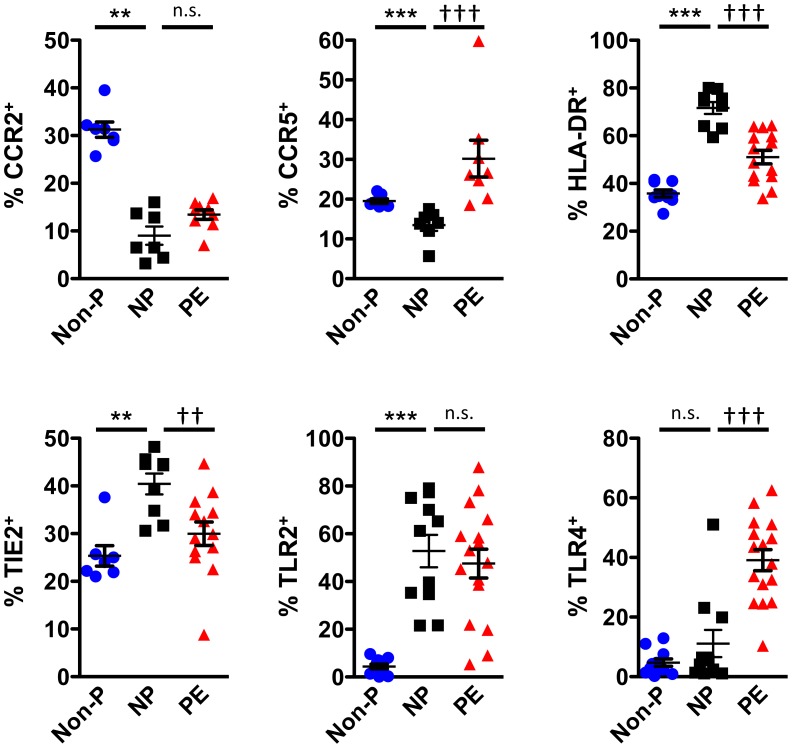
Figure 2. NP and PE monocytes display marked phenotypic differences.
PBMCs from non-pregnant (Non-P), normal pregnant (NP), and pre-eclampsia (PE) patients were stained with anti-CD14-AlexaFluor700, anti-CD16-eFluor450, anti-CCR2-PE, anti-CCR5-FITC, anti-HLA-DR-PerCP-Cy5.5, anti-TIE2-APC, anti-TLR2-FITC, and anti-TLR4-PE antibodies then analyzed by flow cytometry. Gates were placed around monocytes on FSC/SSC plots and the percentage of positive cells was calculated based off isotype controls. Values are illustrated as mean ± SEM. Statistical significance was determined by Mann-Whitney U test (n = 5−16). n.s. = not significant, **p<0.01, ***p<0.001 as compared with Non-P; † p<0.05, †† p<0.01, ††† p<0.001 as compared with NP.

