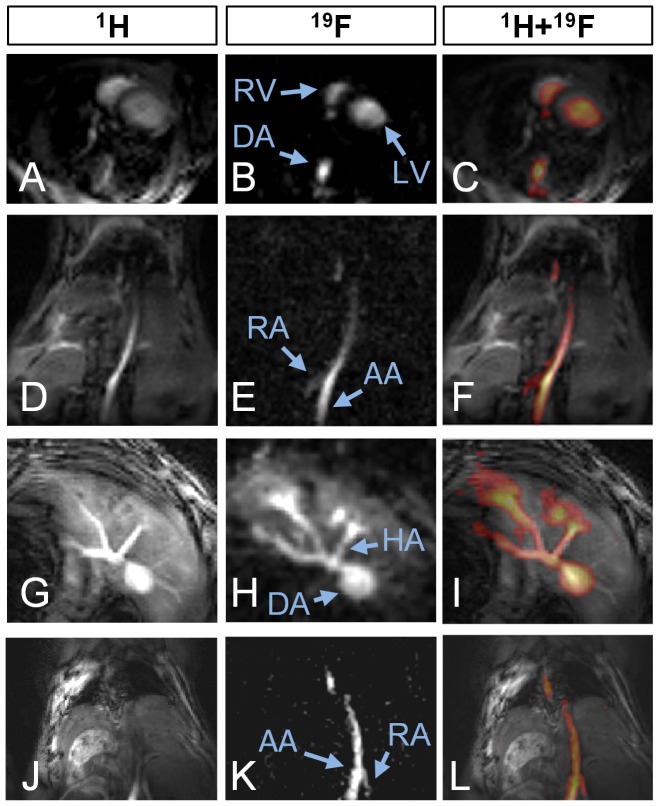
Figure 3. Three series of 3 in vivo mouse images, with 1H reference images in the left column, 19F images in the middle and a color image fusion of the two in the right column.
a–c) axial slice through the heart, with a ECG-triggered to counter motion blurring, which is not needed in b because of the averaging (RV = right ventricle, LV = left ventricle, AA = abdominal aorta). d–f) Coronal slice through the lungs (dark at the top), DA and the kidneys (at the bottom), where the renal artery (RA) can be discerned. g–i) Axial slice at the level of the liver. In h, the hepatic artery (HA) and several others can be discerned while PCE is also temporarily stored in the surrounding liver tissue, thus decreasing the conspicuity of the vessels. j–l) Coronal slice through the abdominal aorta. Varying vessel contrast can be observed in j, which is not present in k.

