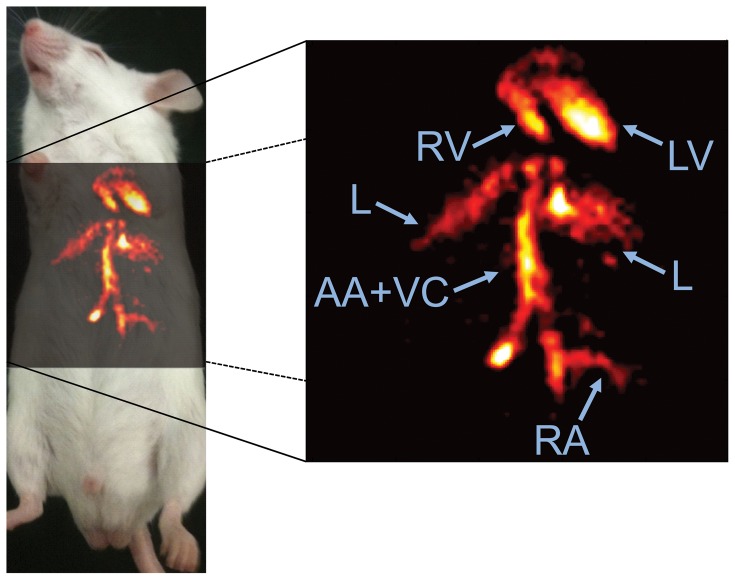
Figure 4. Distribution of crown ether in the vasculature of the thorax in a mouse in vivo, 3h after injection.
Shown here is a 19F MRA coronal maximum intensity projection created from 6 adjacent slices with a thickness of 2mm each. The image shows the lumen of several cardiovascular structures including the right ventricle (RV), left ventricle (LV), abdominal aorta and vena cava (AA+VC), and a renal artery (RA), as well as the liver (L).

