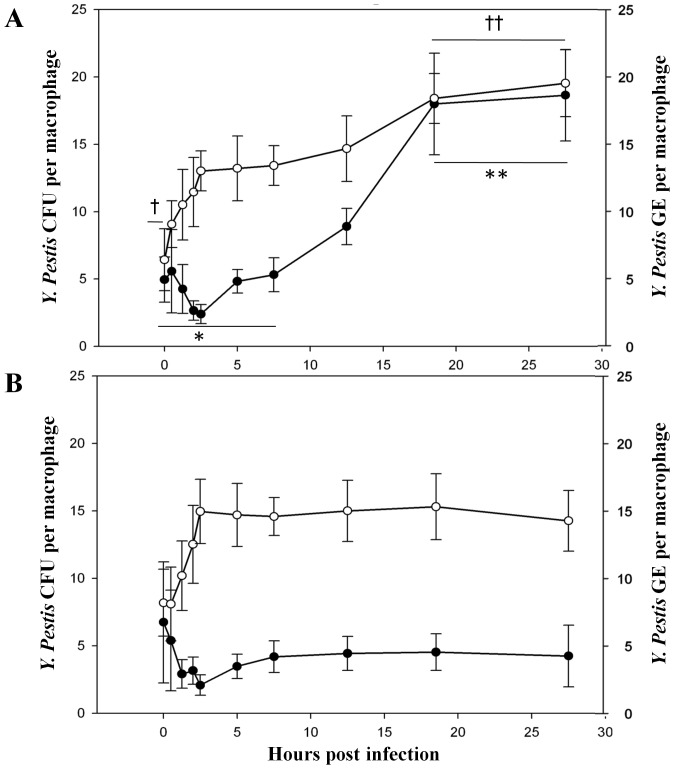
Figure 3. Intracellular CFUs and GEs per tissue culture macrophage at various times p.i.
CFUs (•) for culturable and GEs (○) for total Y. pestis per RAW264.7 (A) and DH82 (B) were calculated for various intervals from 0 to 27.5 h p.i. using microplate based colony counting and qPCR methods described in Materials and Methods section. The results are expressed as mean ± SEM (n = 3). Means and variances of CFUs or GEs per macrophage at different p.i. intervals for RAW264.7 and DH82 cells were analyzed initially using one-way ANOVA. No significant differences were found between means within groups denoted * for CFUs per macrophage for 0 to 7.5 h p.i., † GEs per macrophage for 0 to 0.5 h p.i., ** for CFUs per macrophage for 18.5 to 27.5 h p.i., or †† GEs per macrophage for18.5 to 27.5 h p.i.. The groups were then tested for significant differences at p = 0.05 between groups using a ‘Tukey HSD’ post hoc method. The means for * CFUs per macrophage for 0 to 7.5 h p.i. differed from the means for ** CFUs per macrophage for 18.5 to 27.5 h p.i. at the p<0.05 level, and the means for † GEs per macrophage for 0 to 0.5 h p.i. differed from the means for the †† GEs per macrophages for 18.5 to 27.5 h p.i. at the p<0.05 level.

