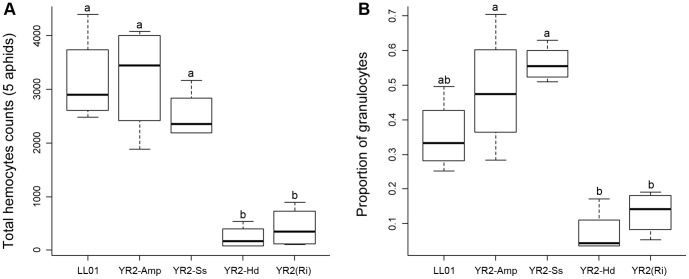
Figure 5. Total hemocyte counts (THC) and granulocyte proportions from AHPs of the different lines.
Box-plot representations of the THC (A) and the proportion of granulocytes (B), estimated on F-actin stained AHPs (pools of 5 adults per AHP), for aphid lines listed in Table 1. Box-plots with the same letter have means that are not significantly different (TukeyHSD, alpha = 5e-03, n = 4).

