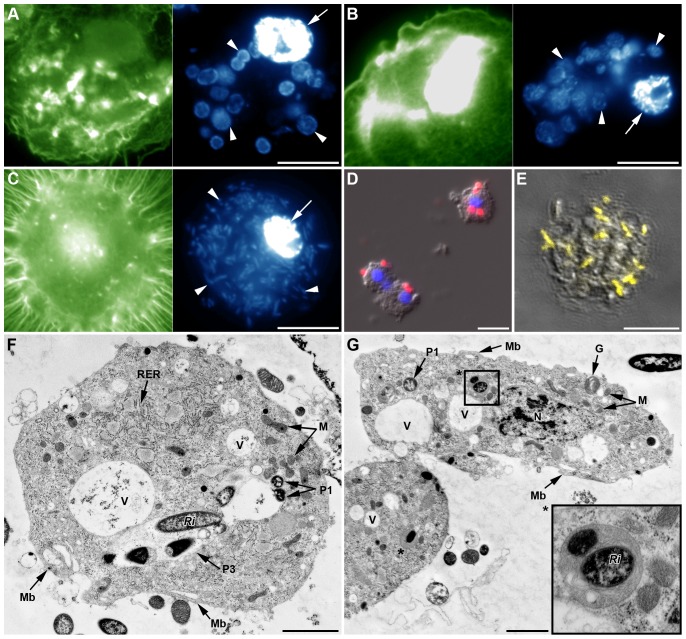
Figure 9. In vivo phagocytosis of primary symbionts and injected secondary symbionts in LL01 and YR2-Amp aphids (devoid of SS).
(A–B) Fluorescent images of AHP from LL01 (A) and YR2-Amp (B) unchallenged lines. Hemocytes have taken up B. aphidicola (Ba) cells (arrowheads); F-actin in green, DNA in blue, arrows indicate cell nuclei. (C) Fluorescent images of AHP from the LL01 line, 24 h after injection of R. insecticola (Ri) secondary symbionts. Ri are observed in the cytoplasm of a granulocyte (arrowhead); F-actin in green, DNA in blue, arrows indicate cell nuclei. (D) Overlay of DIC and fluorescent images from AHP of unchallenged LL01 aphids, showing FISH detection of Ba cells (red fluorescence) in contact or within adherent hemocytes. Nuclei are counterstained with DAPI (blue fluorescence). (E) Overlay of DIC and confocal images showing FISH detection of Ri secondary symbionts (yellow fluorescence, false color) in a granulocyte of an LL01 aphid, 24 h post-injection. (F–G) TEM showing secondary symbionts Ri within LL01 hemocytes 24 h post-injection. Notice the high vacuolization (V: Vacuoles), the presence of membrane ruffles (Mb) and the phagosomes containing ingested Ri. (F) LL01 Plasmatocyte showing two zipper-like phagosomes containing individual bacteria (P1) and a macropinocytosis-like phagosome (P3) containing several symbionts, some in advanced state of degradation (high darkening). (G) LL01 granulocytes showing zipper-like phagosome (P1) and phagolysosomes containing symbionts (asterisk and box magnified). Scale bar: 10 µm (A–E), 1 µm (F) and 2 µm (G). N: Nucleus; M: Mitochondria; RER: Rough endoplasmic reticulum; G: Granule.

