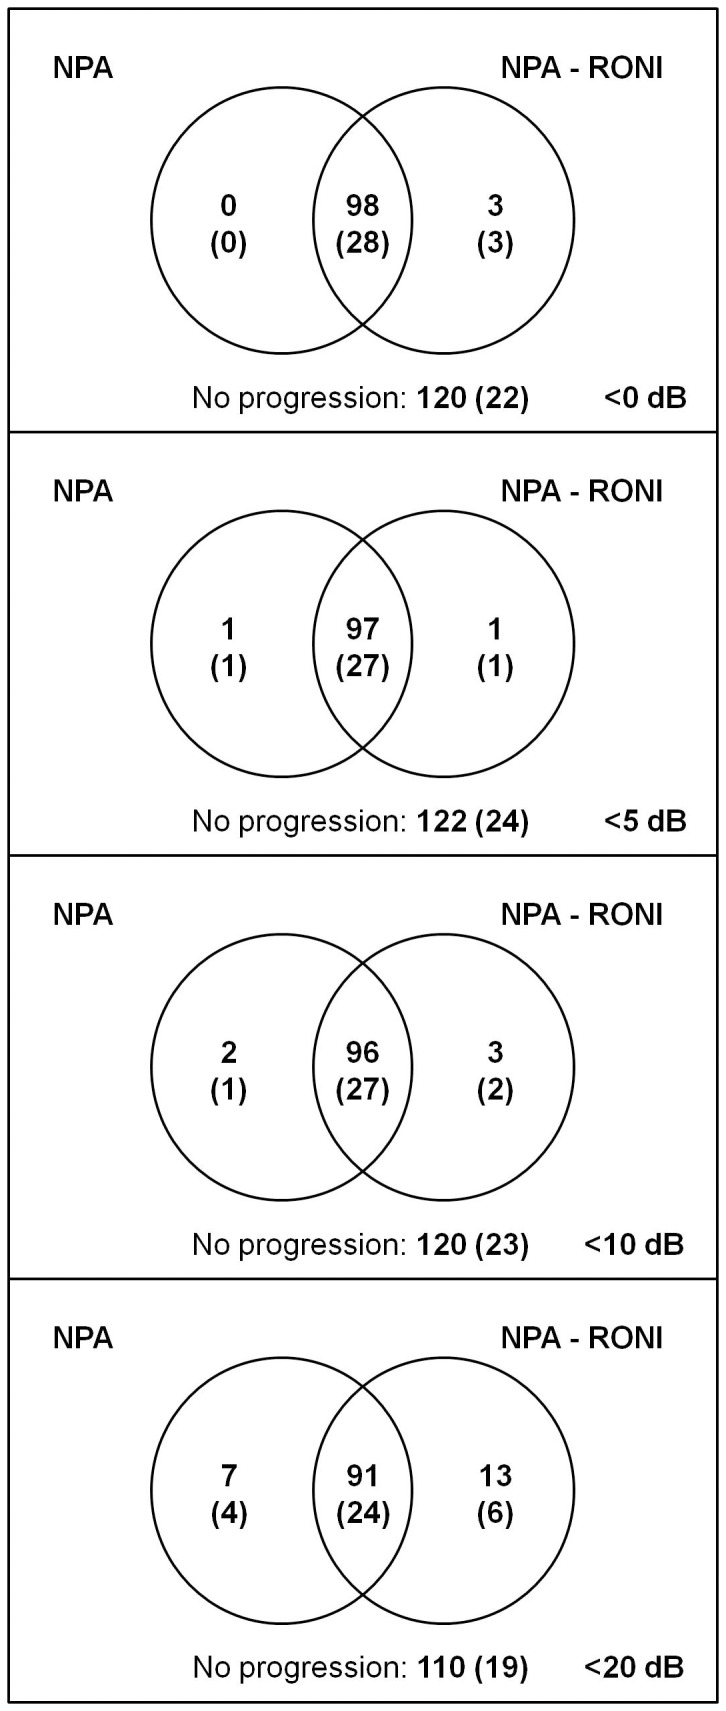
Figure 5. Venn diagrams showing progression according Nonparametric Progression Analysis (NPA) versus NPA after removing all test locations that were blind on the first three tests (NPA-RONI, where RONI is regions of no interest).

Four different definitions of blindness were used: <0, <5, <10 and <20 dB. Results for all 221 subjects with results for the subset of 53 subjects between brackets.
